My favorite SEO tool isn’t an SEO tool at all. Don’t get me wrong, I use and like plenty of great SEO tools. But I realized that I was using this one tool all the time.
Chrome Developer Tools how I love thee, let me count the ways.
Chrome Developer Tools
The one tool I use countless times each day is Chrome Developer Tools. You can find this handy tool under the View -> Developer menu in Chrome.
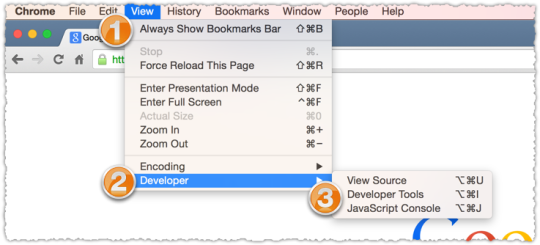
Or you can simply right click and select Inspect Element. (I suppose the latter is actually easier.) Here’s what it looks like (on this site) when you open Chrome Developer Tools.

There is just an incredible amount of functionality packed into Chrome Developer Tools. Some of it is super technical and I certainly don’t use all of the features. I’m only going to scratch the surface with this post.
But hopefully you’re not overwhelmed by it all because there are some simple features that are really helpful on a day-to-day basis.
Check Status Codes
One of the simplest things to do is to use the Network tab to check on the status code of a page. For instance, how does a site handle domain level canonicalization.

With the Network tab open I go directly to the non-www version of this site and I can see how it redirects to the www version. In this case it’s doing exactly what it’s supposed to do.
If I want more information I can click on any of these line items and see the headers information.
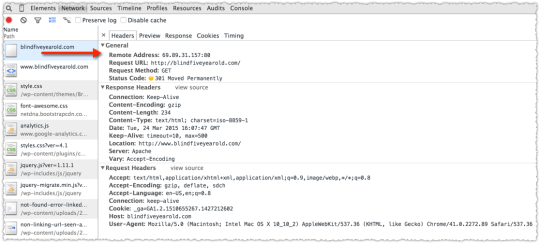
You can catch some pretty interesting things by looking at what comes through the Network tab. For instance, soon after a client transitioned from http to https I noted the following response code chain.
An https request for a non-www URL returned a 301 to the www http version (domain level canonicalization) and then did another 301 to the www https version of that URL.
The double 301 and routing from https to http and back again can (and should) be avoided by doing the domain level canonicalization and https redirect at the same time. So that’s what we did … in the span of an hour!
I won’t get into the specifics of what you can tease out of the headers here because it would get way too dense. But suffice to say it can be a treasure of information.
Of course there are times I fire up something more detailed like Charles or Live HTTP Headers, but I’m doing so less frequently given the advancements in Chrome Developer Tools.
Check Mobile
There was a time when checking to see how a site would look on mobile was a real pain in the ass. But not with Chrome Developer Tools!

The little icon that looks like mobile phone is … awesome. Click it!
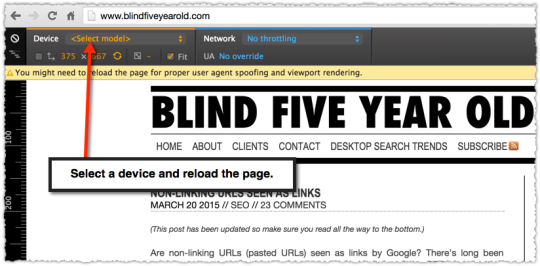
Now you can select a Device and reload the page to see how it looks on that device. Here’s what this site looks like on mobile.
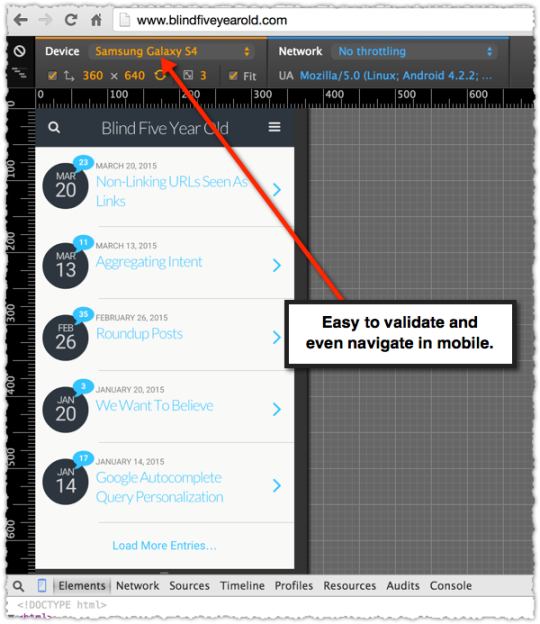
The cool thing is you can even click around and navigate on mobile in this interface to get a sense of what the experience is really like for mobile users without firing up your own phone.
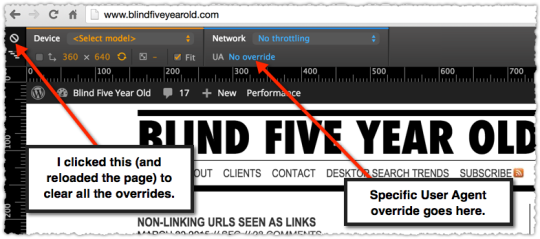
A little bonus tip here is that you can clear the device by clicking the icon to the left and then use the UA field to do specific User Agent (UA) testing.
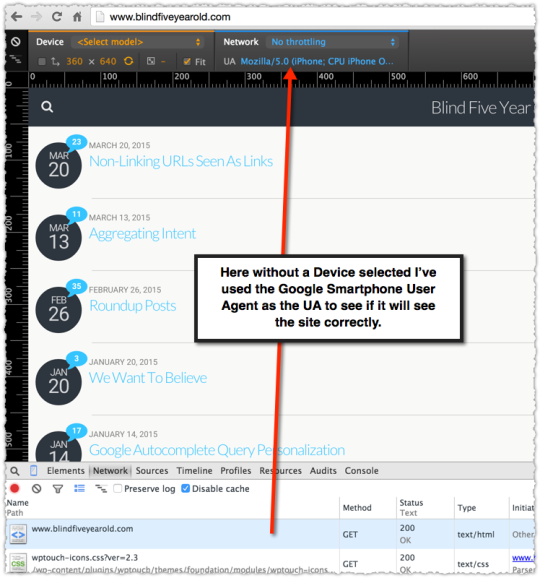
For instance, without a Device selected what happens when Googlebot Smartphone hits my site. All I have to do is use the UA override and put in the Googlebot Smartphone User Agent.
Sure enough it looks like Googlebot Smartphone will see the page correctly. This is increasingly important as we get closer to the 4/21/15 mopocalypse.
You can copy and paste from the Google Crawlers list or use one of a number of User Agent extensions (like this one) to do this. However, if you use one of the User Agent extensions you won’t see the UA show up in the UA field. But you can confirm it’s working via the headers in the Network tab.
Show Don’t Tell
The last thing I’ll share is how I use Chrome Developer Tools to show instead of tell clients about design and readability issues.
If you go back to some of my older posts you’ll find that they’re not as readable. I had to figure this stuff out as I went along.
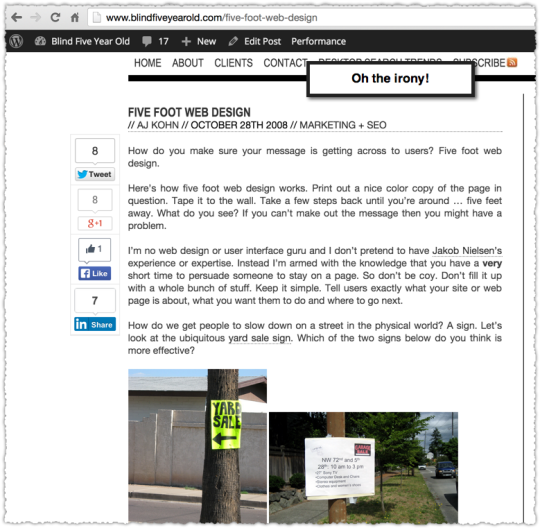
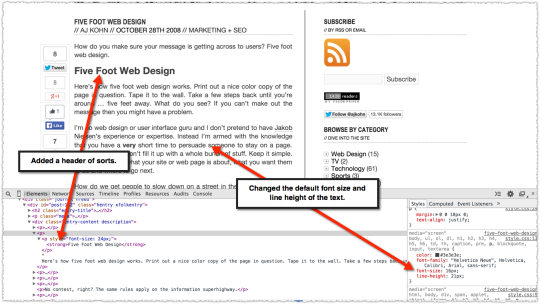
This is a rather good post about Five Foot Web Design, which pretty much violates a number of the principles described in the piece. I often see design and readability issues and it can be difficult for a client to get that feedback, particularly if I’m just pointing out the flaws and bitching about it.
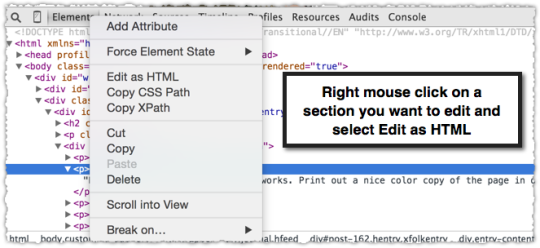
So instead I give them a type of side-by-side comparison by editing the HTML in Chrome Developer Tools and then taking a screen capture of the optimized version I’ve created.
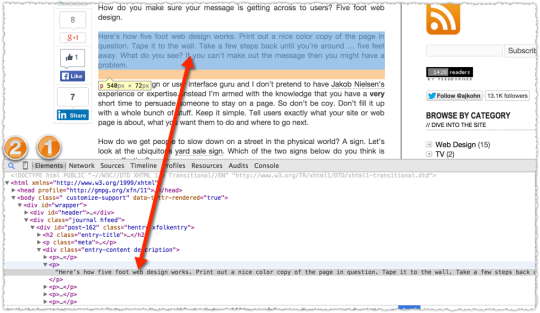
You do this by using the Elements tab (1) and then using the Inspect tool (2) to find the area of the code you want to edit.
The inspect tool is the magnifying glass if you’re confused and it just lets you sort of zero in on the area of that page. It will highlight the section on the page and then show where that section resides in the code below.
Now, the next step can be a bit scary because you’re just wading into the HTML to tweak what the page looks like.
A few things to remember here. You’re not actually changing the code on that site or page. You can’t hurt that site by playing with the code here. Trust me, I screw this up all the time because I know just enough HTML and CSS to be dangerous.
In addition, if you reload this page after you’ve edited it using Chrome Developer Tools all of your changes will vanish. It’s sort of like an Etch-A-Sketch. You doodle on it and then you shake it and it disappears.
So the more HTML you know the more you can do in this interface. I generally just play with stuff until I get it to look how I want it to look.
Here I’ve added a header of sorts and changed the font size and line height. I do this sort of thing for a number of clients so I can show them what I’m talking about. A concrete example helps them understand and also gives them something to pass on to designers and developers.
TL;DR
Chrome Developer Tools is a powerful suite of tools that any SEO should be using to make their lives easier and more productive.
The Next Post: Why Growth Hacking Works
The Previous Post: Non-Linking URLs Seen As Links

8 trackbacks/pingbacks
Comments About My Favorite SEO Tool
// 27 comments so far.
Itamar Gero // March 24th 2015
Indeed a very utilized tool that can troubleshoot so much that’s wrong with a site/page.
Being a developer and a firebug user for years the Chrome Dev Tools has an edge and works smooth compared to fb. (not to meantion the mobile view that fb doesn’t have)
AJ Kohn // March 25th 2015
Itamar,
Thanks for your comment. I was an old Firebug user as well but when Chrome became the better browser (based on speed really) I found Chrome Developer Tools. At first they were neck-and-neck and I might even dive back to Firefox just for Firebug but over time Chrome Developer Tools surpassed Firebug and now there’s just no looking back.
Brian Jensen // March 24th 2015
Thanks AJ, it was nice to get a refresher, as there a few features I often use other tools for but forget they’re available in Chrome Developer Tools. I do love the ability to change-up the HTML in the Elements tab.
AJ Kohn // March 25th 2015
Thanks Brian. I’m a huge fan of changing the HTML in the Elements tab. It makes it so much easier when talking with clients. If you’re really feeling cheeky you can do screen sharing on Skype or Google+ Hangout and demonstrate the differences to a client in real time.
Dave Elliott // March 25th 2015
Didn’t know about the mobile bit. Actually looks about the same as on my phone, so, thank you for that!
AJ Kohn // March 25th 2015
Dave,
I find a lot of people missed the release where Chrome Developer Tools provided mobile emulation. I’ve introduced it to a number of clients over the last year (who were equally surprised) and wrote this post to ensure more folks knew about the functionality.
Per Pettersson // March 25th 2015
Good reminder of these, sort of, hidden gems in Chrome.
AJ Kohn // March 25th 2015
Thanks Per and they are hidden gems, just sitting there under our noses.
Rick // March 25th 2015
AJ –
Great stuff. I knew some of that was there but have become accustomed to using some extensions for similar functionality, notably Redirect Path, Web Developer and User Agent Switcher. Nice to know I can accomplish as much and more built in, especially when driving someone else’s browser or when not communicating in person.
Have to say that Redirect Path will always stay loaded because it provides a visual cue to redirects that would otherwise be easily missed including some nasty chain redirects I’ve discovered. In one case, I found a series that included a mix of 301 & 302 redirects and a robots blocked url in the middle.
Being able to toggle JavaScript on/off and change the user agent is also incredibly powerful. For example, I’m seeing sites that redirect to a mobile experience for iPhones but not Googlebot which can be very frustrating to the site owner to diagnose. Another common use case is displaying how Google views a hacked site when the pharmaceutical text is invisible to the normal visitor.
AJ Kohn // March 25th 2015
Thanks Rick. I like all of those extensions as well and use them, though less lately because of everything that is built into Chrome Developer Tools. There’s even the ability to toggle JS now, though it’s not as easy as the Web Developer extension.
I’m hopeful that Chrome Developer Tools will continue to evolve and get better. I’m guessing it will too since it seems like Google is dogfooding the product.
josh bachynski // March 25th 2015
Very clever. I would expect nothing less from another SEO veteran.
I applaud.
Nick C // March 25th 2015
Hey AJ – great post! I’ve used the developer tools before, but very helpful to see it taken a step further.
Quick question for you on the Googlebot Smartphone User Agent section. I just tried to copy and paste the smartphone UA text from the crawler list (with no device selected) and it’s not giving me a mobile view. I even tried doing it on your site to try and replicate your mobile view screenshot, but still didn’t work. Am I missing something?
Thanks!
AJ Kohn // March 25th 2015
Nick,
I had to deactivate the mobile plugin (WPTouch) because too many people were reporting that they were getting mangled mobile versions on their desktop. It seems like the mobile plugin doesn’t play nice with the cache.
So that’s why it won’t work on my site. But if you go to another large site on the desktop and plugin the mobile user agent and refresh you should see it return the mobile version.
Robin Ooi // March 30th 2015
Hey AJ,
Didn’t realize they have similar tool like this in Chrome.
I’ve always been using Firebug in Mozilla.
The irony is that I use Chrome 95% of the time!
Thanks for sharing.
Cheers,
Robin Ooi
AJ Kohn // March 30th 2015
Thanks Robin. I was a big Firebug user for a long time and used to switch over to Firefox just to use it. But Chrome Developer Tools surpassed Firebug a while ago and I haven’t looked back since.
Toronto SEO LAB // April 06th 2015
Also the console tab is great to find non-secure items on the page, when optimizing content for https. It shows all non-secure items.
AJ Kohn // April 07th 2015
Very true Mr. Toronto. Another little gem in the toolset.
Katrina Starkweather // April 07th 2015
This is great overview of how to use Chrome Developer Tools! Thanks, AJ. I knew I could do more with it, but with my ever growing “things to learn today” list I hadn’t spent much time with it. This post goes in my Evernote under SEO. Thanks again.
AJ Kohn // April 07th 2015
Thanks Katrina. Glad this helps and hope it gets you going with Chrome Developer Tools. Once you start futzing with it you’ll see just how much is under the hood.
Jon // April 07th 2015
Good writeup. Very underused. Worth noting that F12 (on Windows at least) will show the Developer Toolbar too.
Isaac Moan // April 07th 2015
I’m a web developer and I use the chrome inspector as a crucially vital tool to adjust my designs ahead of time before changing the actual CSS. It’s amazing, and with the ability to preview on all the different mobile browsers, it’s something I just can’t live without.
Vitaliy // April 08th 2015
You got it. It’s a tool that I also use on a pretty much daily basis, but your article gave me one or two more ideas how to use it. Up until now, I used it mostly to check if the link that points to my site has rel=”nofollow” or not.
Phigit Digital Marketing // April 08th 2015
We have been manually testing on different devices. This will save some time and we will not have to manually view the source.
Paddy // April 14th 2015
Great post! Thanks for this!
Kumer // April 15th 2015
Thanks AJ, Now I will be able to use the chrome inspector as a crucially vital tool to adjust my designs ahead of time before changing the actual CSS. It’s awesome.
Jan // June 08th 2015
Great post thanks for sharing.
Kr
Matt Roberts // September 05th 2015
This tool + brain = best SEO tool !!
Sorry, comments for this entry are closed at this time.
You can follow any responses to this entry via its RSS comments feed.