You Are Browsing The SEO Category

Google Cache Bookmarklets

April 14 2024 // SEO + Technology // 10 Comments

Earlier this year Google retired the links to its web cache. “This has made a lot of people very angry and been widely regarded as a bad move.

Don't Panic

The feature still exists (for now) as long as you know the right URL pattern. So I dusted off my JavaScript skills and created a set of three bookmarklets, one for each type of web cache result.

Full Version Cache
Text Only Cache
View Source Cache

Just drag the highlighted links above to your bookmarks bar. Then click the bookmark to see the cache of your choice for the page you’re on.

Honestly, you probably only need one of these since you can navigate to the other version once you’re in the cache. But it was a fun 8 minutes figuring out the parameters that mapped to each one.

Enjoy and let me know if you encounter any problems.

What Pandu Nayak Taught Me About SEO

November 16 2023 // SEO // 36 Comments

Okay, Pandu Nayak didn’t exactly teach me about SEO.

But his October 18 anti-trust hearing testimony was both important and educational. And I’m a better SEO when I understand how Google really works.

Pandu Nayak is Vice President of Search working on various aspects of Search Quality. He’s been at Google for 18 years and is the real deal when it comes to search at Google.

I’m going to highlight areas from the October 18 transcript (pdf) I find notable or interesting and afterwards tell you how I apply this to my client work. The entire transcript is well worth your time and attention.

In all of the screenshots the Q. will be Department of Justice counsel Kenneth Dintzer, The Court will be Judge Amit P. Mehta while A. or The Witness will be Pandu Nayak.

Navboost

Why the interest in Navboost?

Remember, it was said to be “one of Google’s strongest ranking signals” and is mentioned 54 times in this transcript, making it the fifth most mentioned term overall.

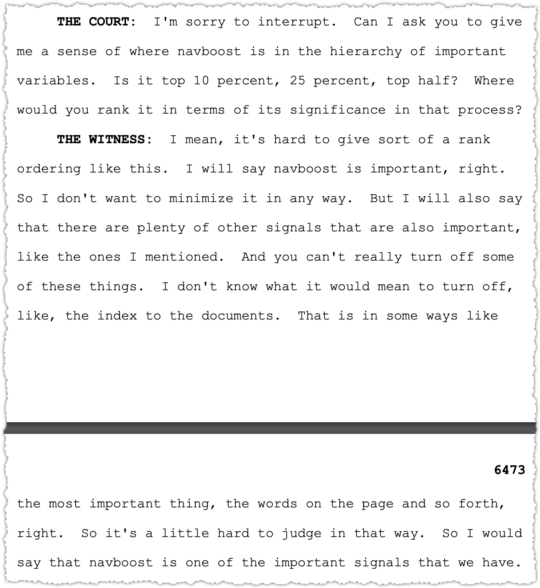
Nayak also acknowledges that Navboost is an important signal.

Pandu Nayak testimony about importance of navboost

I touched on Navboost in my It’s Goog Enough! piece and now we have better explanations about what it is and how Google uses it.

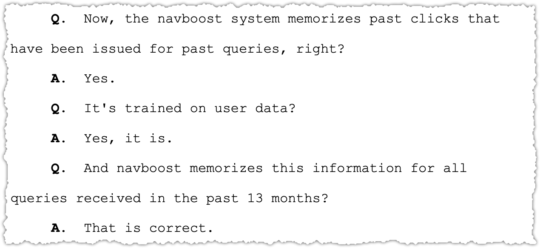
Pandu Nayak testimony on click data and navboost

Navboost is trained on click data on queries over the past 13 months. Prior to 2017, Navboost was trained on the past 18 months of data.

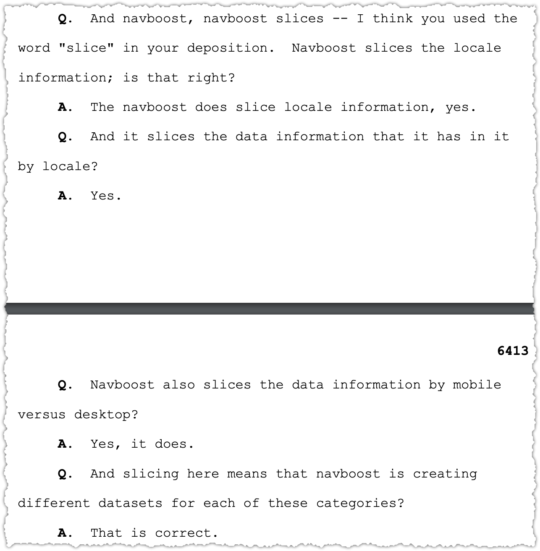
Pandu Nayak testimony covering navboost slices

Navboost can be sliced in various different ways. This is in line with the foundational patents around implicit user feedback.

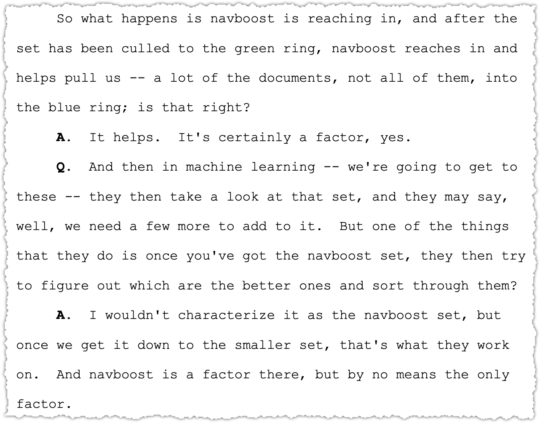
Pandu Nayak testimony about navboost culling function

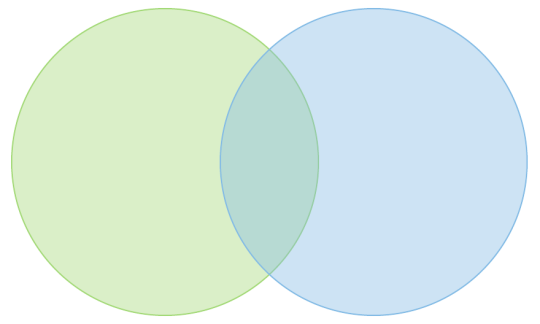
There are a number of references to moving a set of documents from the “green ring” to the “blue ring”. These all refer to a document that I have not yet been able to locate. However, based on the testimony it seems to visualize the way Google culls results from a large set to a smaller set where they can then apply further ranking factors.

There’s quite a bit here on understanding the process.

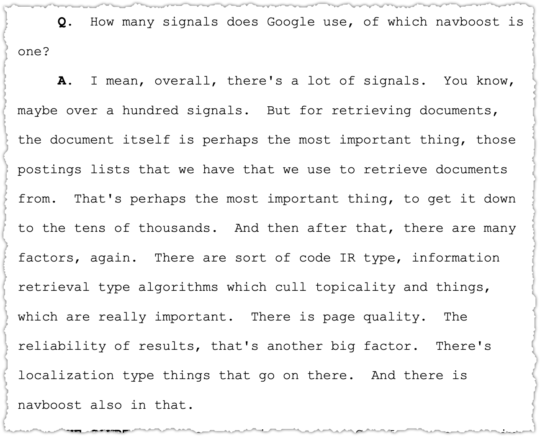
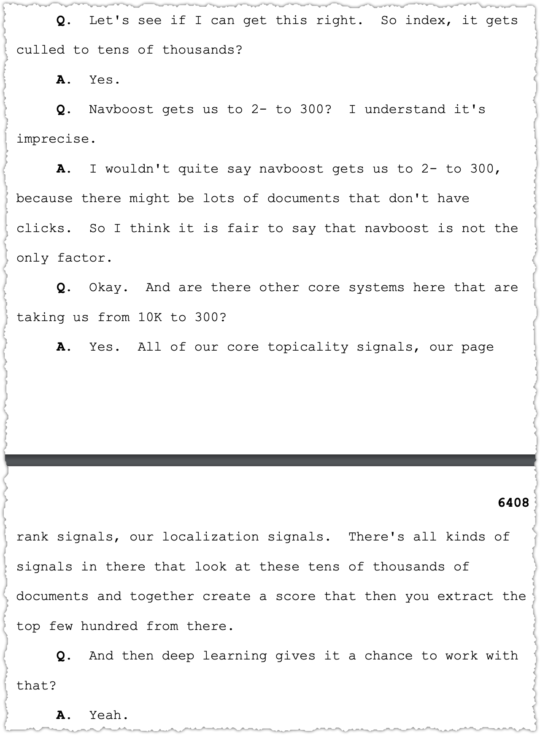
Pandu Nayak testimony about stages of information retrieval

Pandu Nayak testimony describing information retrieval process

Nayak is always clear that Navboost is just one of the factors that helps in this process. And it’s interesting that one of those reasons is some documents don’t have clicks but could still be highly relevant. When you think about it, this has to be the case or no new content would ever have a chance to rank.

There is also interesting insights into the stages of informational retrieval and when they apply different signals.

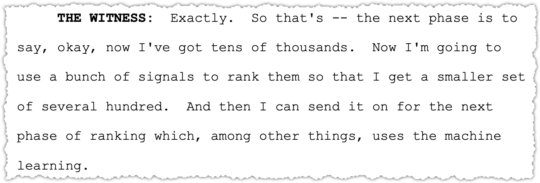
Pandu Nayak testimony about reducing the set to a manageable number for machine learning

I assume the deep learning and machine learning signals are computationally expensive, which is why they are applied to the final set of candidate documents. (Though I’ve read some things about passage ranking that might turn this on it’s head. But I digress.)

So Navboost is still an important signal which uses the memorized click data over the last 13 months.

Glue

Super Glue

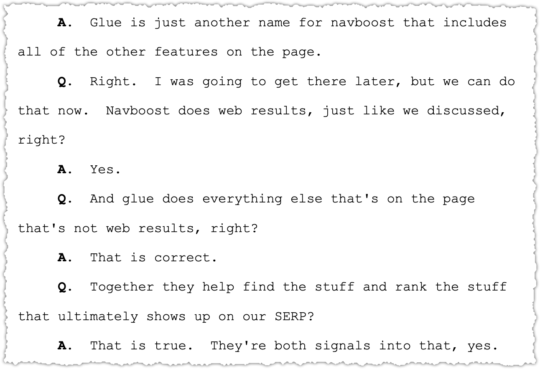
Glue is the counterpart to Navboost and informs what other features are populated on a SERP.

Pandu Nayak testimony on glue

Though not explicitly stated, if Glue is another name for Navboost but for all of the other features on the page then it stands to reason that it’s logging the user interactions with features for all queries over the last 13 months.

So it might learn that users are more satisfied when there’s a video carousel in the SERP when searching for a movie title.

Tangram (née Tetris)

Tangram Puzzle

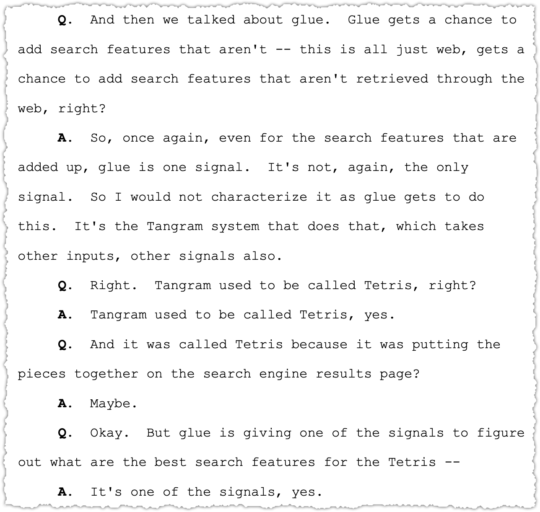
The system that works to put all of the features on a SERP is called Tangram.

Pandu Nayak testimony about glue, tangram and tetris

I kind of like the name Tetris but Tangram essentially has the same meaning. It’s a complex and intricate puzzle.

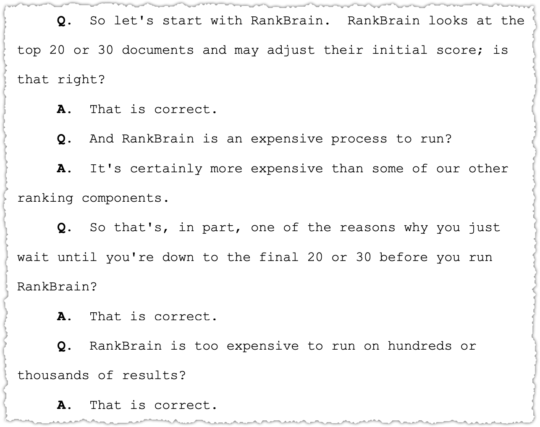
RankBrain

Now we can leave click data behind and turn our attention to the modern deep learning models like RankBrain. Right? Well … here’s the thing.

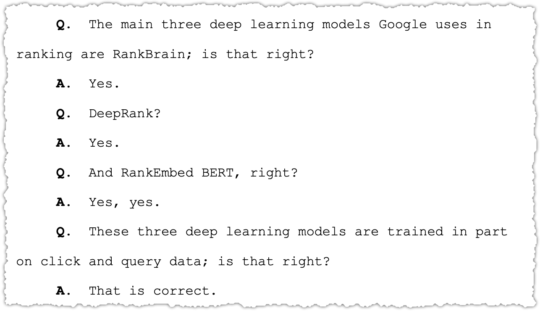
Pandu Nayak testimony about deep leaning models

All of the deep learning models used by Google in ranking are trained, in part, on click and query data. This is further teased out in testimony.

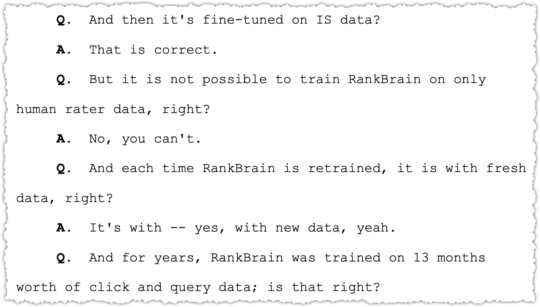
Pandu Nayak testimony on how RankBrain is trained

Pandu Nayak testimony on RankBrain training cadence

None of this surprises me given what I know. In general, these models are trained on the click data of query-document pairs. Honestly, while I understand the concepts, the math in the papers and presentations on this subject are dense to say the least.

As mentioned above, RankBrain is run on a smaller set of documents at the tail end of ranking.

Pandu Nayak testimony about when RankBrain is used

I’m not quite sure if RankBrain is part of the ‘official’ rank modifier engine. That’s a whole other rabbit hole for another time.

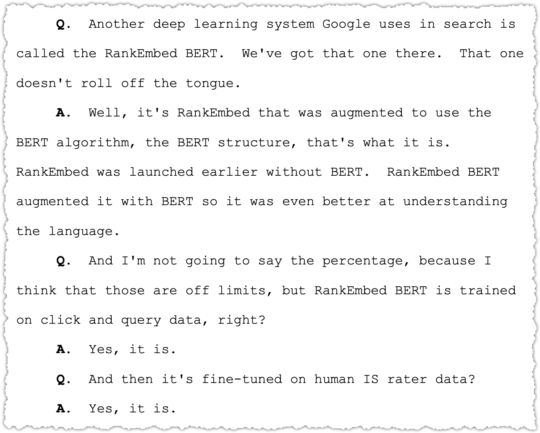
RankEmbed BERT

What about RankEmbed BERT?

Pandu Nayak testimony about RankEmbed BERT

Embed is clearly about word embeddings and vectors. It’s essentially a way to turn words into math. Early models like word2vec were context insensitive. BERT, due to it’s bi-directional nature, provided context-sensitive embeddings. I cover a bunch of this in Algorithm Analysis In The Age of Embeddings.

This was a major change in how Google could understand documents and may have made Google a bit less reliant on implicit user feedback.

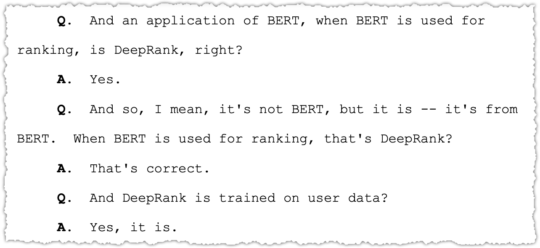
DeepRank

DeepRank seems to be the newest and most impactful deep learning model used in ranking. But it’s a bit confusing.

Pandu Nayak testimony about DeepRank

It seems like DeepRank is not exactly different but just when BERT is using for ranking purposes.

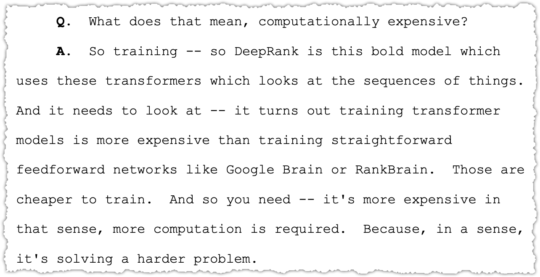
Pandu Nayak testimony about DeepRank as a transformer model

It would make sense that DeepRank uses transformers if it’s indeed a BERT based model. (Insert Decepticons joke here.)

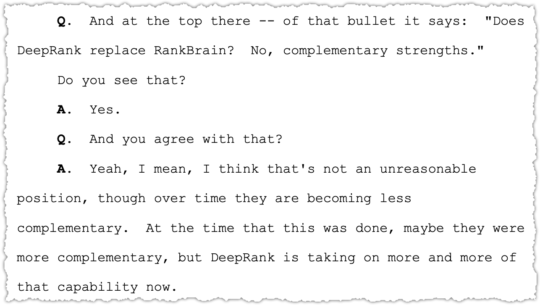
Pandu Nayak testimony about DeepRank taking over functions from RankBrain

Finally we get some additional color on the value of DeepRank in comparison to RankBrain.

There’s no question that Google is relying more on deep learning models but remain hesitant (with good reason) to rely on them exclusively.

Information Satisfaction (IS) Scores

Action Figure Scores

You may have noticed references to human rates and IS scores. Nowhere in the transcript does it tell you what IS stands for but Google’s Response to ACCC Issues Paper (pdf) contains the meaning.

“Google tracks search performance by measuring “information satisfaction” (IS) scores on a 100 point scale. IS is measured blind by Search Quality Raters …”

So IS scores are from human raters via the Search Quality Evaluator Guidelines (pdf).

There’s a large description about how these ratings are conducted and how they’re used from fine tuning to experimentation.

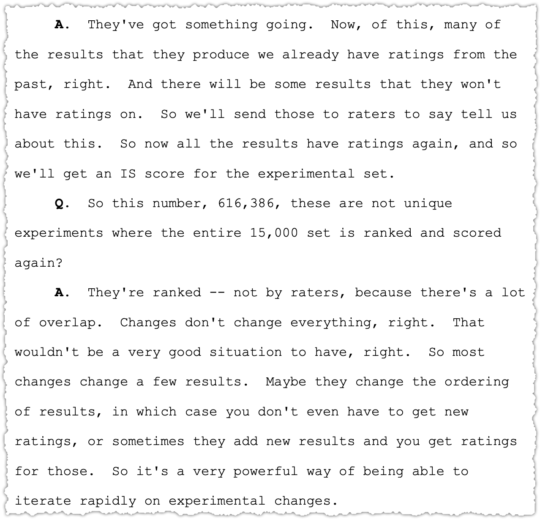
Pandu Nayak testimony on IS scores and experimentation

The number that pops out for me is the 616,386 experiments which is either the number of experiments from 2020 alone or since 2020.

I struggle a bit with how this works, in part because I have issues with the guidelines, particularly around lyrics. But suffice to say, it feels like the IS scores allow Google to quickly get a gut check on the impact of a change.

Pandu Nayak testimony on ease of IS experimentation

While not explicitly said, there is mention to columns of numbers that seem to reference the experiment counts. One is for IS score experiments and the other seems to be for live testing.

Interleaving

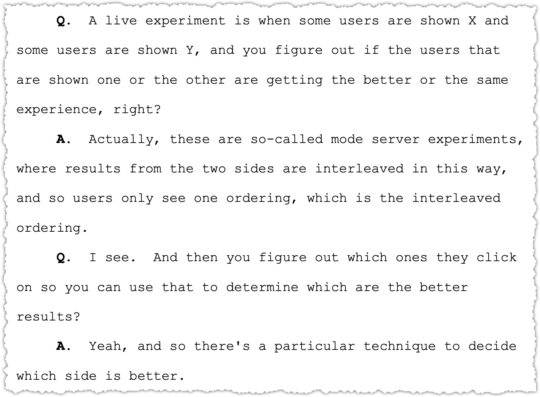
Live tests are not done as traditional A/B tests but instead employ interleaving.

Pandu Nayak testimony on live testing using interleaving

There are a number of papers on this technique. The one I had bookmarked in Raindrop was Large-Scale Validation and Analysis of Interleaved Search Evaluation (pdf).

I believe we’ve been seeing vastly more interleaved tests in the last three years.

So Frickin What?!

Why Do You Care?

A number of people have asked me why I care about the mechanics and details of search. How does it help me with clients? Someone recently quipped, “I don’t see how this helps with your SEO shenanigans.”

My first reaction? I find the topic interesting, almost from an academic perspective. I’m intrigued by information retrieval and how search engines work. I also make a living from search so why wouldn’t I want to know more about it?

But that’s a bit of a lazy answer. Because I do use what I learn and apply it in practice.

Engagement Signals

For more than a decade I’ve worked under the assumption that engagement signals were important. Sure I could be more precise and call them implicit user feedback or user interaction signals but engagement is an easier thing to communicate to clients.

That meant I focused my efforts on getting long clicks. The goal was to satisfy users and not have them pogostick back to search results. It meant I was talking with clients about UX and I became adamant about the need to aggregate intent.

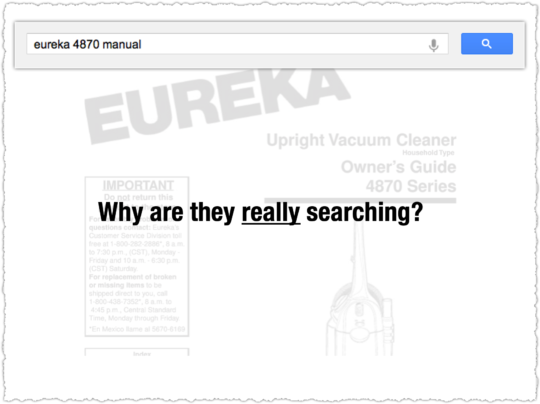
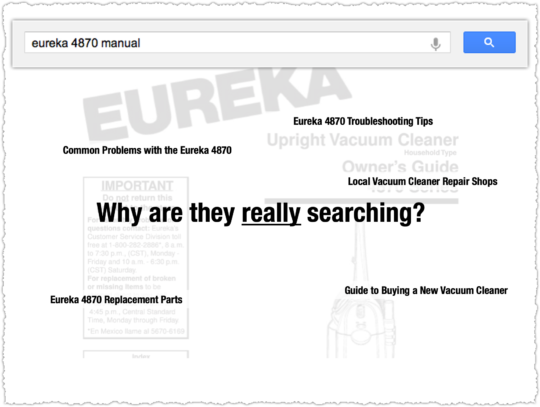
Here’s one example I’ve used again and again in presentations. It’s a set of two slides where I ask why someone is searching for a ‘eureka 4870 manual’.

Someone usually says something like, ‘because the vacuum isn’t working’. Bingo!

Satisfying active intent with that manual is okay.

Aggregating Intent - active intent.

But if you know why they’re really searching you can deliver not just the manual but everything else they might need or search for next.

Aggregating Intent - Passive

Let’s go with one more example. If you are a local directory site, you usually have reviews from your own users prominently on the page. But it’s natural for people to wonder how other sites rate that doctor or coffee shop or assisted living facility.

My recommendation is to display the ratings from other sites there on your own page. Why? Users want those other ratings. By not having them there you chase users back to the search results to find those other ratings.

This type of pogosticking behavior sends poor signals to Google and you may simply never get that user back. So show the Yelp and Facebook rating! You can even link to them. Don’t talk to me about lost link equity.

Yes, maybe some users do click to read those Yelp reviews. But that’s not that bad because to Google you’ve still satisfied that initial query. The user hasn’t gone back to the SERP and selected Yelp. Instead, Google simply sees that your site was the last click in that search session.

No tricks, hacks or gimmicks. Knowing engagement matters simply means satisfying users with valuable content and good UX.

Navboost

Even before I knew about Navboost I was certain that brands had an advantage due to aided awareness. That meant I talked about being active on social platforms and pushed clients to invest in partnerships.

The idea is to be everywhere your customer is on the Internet. Whether they are on Pinterest or a niche forum or another site I want them to run into my client’s site and brand.

Everything Everywhere All At Once

Perhaps the most important expression of this idea is long-tail search optimization. I push clients to scale short-form content that precisely satisfies long-tail query intent. These are usually top-of-funnel queries that don’t lead to a direct conversion.

Thing is, it is some of the cheapest form of branding you can do online. Done right, you are getting positive brand exposure to people in-market for that product. And that all adds up.

Because the next time a user searches – this time a more mid or bottom-of-funnel term – they might recognize your brand, associate it with that prior positive experience and … click!

I’ve proven this strategy again and again by looking at first touch attribution reports with a 30, 60 and 90 day look back window. This type of multi-search user-journey strategy builds your brand and, over time, may help you punch above your rank from a CTR perspective.

Here’s one more example. I had a type of penicillin moment a number of years ago. I was doing research on one thing and blundered into something else entirely.

I was researching something else using Google Consumer Surveys (RIP) when I learned users wanted a completely different meta description.

Meta description! Not a ranking factor right? It’s not a direct ranking factor.

When we changed from my carefully crafted meta description template to this new meta description the CTR jumped across the board. Soon after we saw a step change in ranking and the client became the leading site in that vertical and hasn’t looked back.

NLP

Google understands language differently than you and me. They turn language into math. I understand some of it but the details are often too arcane. The concepts are what really matter.

What it boils down to in practice is a vigilance around syntax. Google will often say that they understand language better as they launch something like BERT. And that’s true. But the reaction from many is that it means they can ‘write for people’ instead of search engines.

In theory that sounds great. In practice, it leads to a lot of very sloppy writing that will frustrate both your readers and Google. 12 years ago I urged people to stop writing for people. Read that piece first before you jump to conclusions.

Writing with the right syntactic structure makes it easier for Google to understand your content. Guess what? It does the same for users too.

I have another pair of slides that show an exaggerated difference in syntax.

All Weather Fluid Displacement Sculpture

Outdoor Water Fountain

I’d argue that content that is more readable and easier to understand is more valuable – that je ne sais quoi quality that Google seeks.

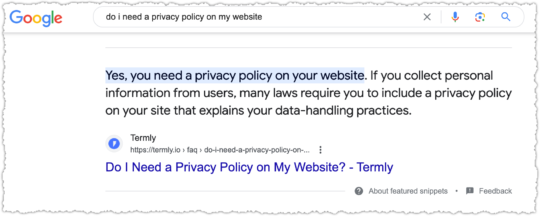
Nowhere is syntax more important than when you’re trying to obtain a featured snippet.

Featured Snippet for Do I Need A Privacy Policy on My Website

However, it’s also important for me to understand when Google might be employing different types of NLP. Some types of content benefit from deep learning models like BERT. But other types of content and query classes may not and still employ a BoW model like BM25.

For the latter, that means I might be more free to visualize information since normal article content isn’t going to lead to a greater understanding of the page. It also means I might be far more vigilant about the focus of the page content.

Interleaving

Google performs far more algorithm tests than are reported on industry sites and the number of tests has accelerated over the last three years.

I see this because I regularly employ rank indices for clients that track very uniform sets of query classes. Some of these indices have data for more than a decade.

What I find are patterns of testing that produce a jagged tooth trend line for average rank. These wind up being either two-steps forward and one-step back (good) or one-step forward and two-steps back (bad).

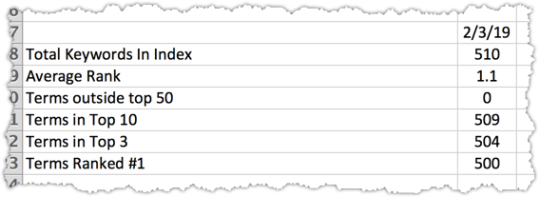
I’m pretty sure I can see when a test ends because it produces what I call a dichotomous result where some metrics improve but others decline. An example might be when the number of terms ranking in the top three go up but the number of terms ranking in the top ten go down.

Understanding the velocity of tests and how they might be performed allows me to calm panicked clients and keep them focused on the roadmap instead of spinning their wheels for no good reason.

TL;DR

Pandu Nayak’s anti-trust testimony provided interesting and educational insights into how Google search really works. From Navboost and Glue to deep learning models like DeepRank, the details can make you a better SEO.

Notes: Auditory accompaniment while writing included OutRun by Kavinsky, Redline by Lazerhawk, Vegas by Crystal Method and Invaders Must Die by The Prodigy.

It’s Goog Enough!

November 08 2023 // SEO // 74 Comments

This blog is in a sad state. It was hacked and the recovery process wasn’t perfect.

I should fix it and I should blog more! But my consulting business is booming. And almost all new business comes via referrals. There’s only so much time – that precious finite resource! So I shrug my digital shoulders and think, it’s good enough.

Good enough might cut it for some random blog. But not for a search engine. Yet, that’s what I see happening in slow-motion over the past few years. Google search has become good enough or as I’ve come to think of it – goog enough.

It'll Do Motel

Photo Credit: John Margolies

So how did we get here? Well, it’s long and complicated. So grab the beverage of your choice and get comfortable.

(Based on reader feedback you can now navigate to the section of your choice with the following jump links. I don’t love having this here because it sort of disrupts the flow of the piece. But I acknowledge that it’s quite long and that some may want to return to the piece mid-read or cite a specific section.)

Brand Algorithm
Implicit User Feedback
Experts On Everything
Unintended Consequences
Weaponized SEO
The Dark Forest
Mix Shift
Information Asymmetry
Incentive Misalignment
Enshittification
Ad Creep
Context Switching and Cognitive Strain
Clutter
Google Org Structure
ChatGPT
Groundhog Day
Editorial Responsibility
Food Court Search Results
From Goog Enough to Great

Brand Algorithm

One of the common complaints is that Google is biased toward brands. And they are, but only because people are biased toward brands.

My background, long ago, is in advertising. So I’m familiar with the concept and power of aided awareness, which essentially measures how well you recognize a brand when you’re prompted (i.e. – aided) with that brand.

Every Google search is essentially an aided awareness test of sorts. When you perform a Google search you are prompted with multiple brands through those search results. The ones that are most familiar often get an outsized portion of the clicks. And as a result those sites will rank better over time.

If you’re not in the SEO industry you may not realize that I just touched a third rail of SEO debate. Does Google use click data in their algorithms? The short answer is yes. The long answer is complex, nuanced and nerdy.

Implicit User Feedback

(Feel free to skip to the Experts On Everything section if technical details make you sleepy.)

I actually wrote about this topic over 8 years ago in a piece titled Is Click Through Rate a Ranking Signal?

I botched the title since it’s more than just click through rate but click data overall. But I’m proud of that piece and think it still holds up well today.

One of the more critical parts of that piece was looking at some of Google’s foundational patents. They are littered with references to ‘implicit user feedback’. This is a fancy way of saying, user click data from search engine results. The summation of that section is worth repeating.

Google foundational patent summary from the piece titled 'Is Click Through Rate a Ranking Signal?

Since I wrote that other things have come to light. The first comes from Google documents leaked by Project Veritas in August of 2019. For the record, I have zero respect for Project Veritas and their goals. But one of the documents leaked was the resume of Paul Haahr.
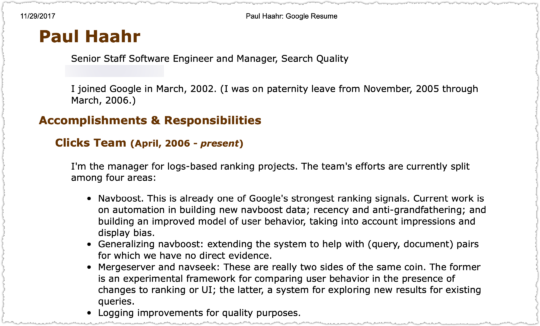
Resume of Paul Haahr from Google leaked documents

The fact that there was a Clicks team seems rather straight-forward and you’d need some pretzel logic to rationalize that it wasn’t about using click data from search results. But it might be easier to make the case using Navboost by looking at how it’s used elsewhere.

In this instance, it’s Pinterest, with the papers Demystifying Core Ranking in Pinterest Image Search (pdf) and Human Curation and Convnets: Powering Item-to-Item Recommendations on Pinterest (pdf).

Here are the relevant sections of both pertaining to Navboost.
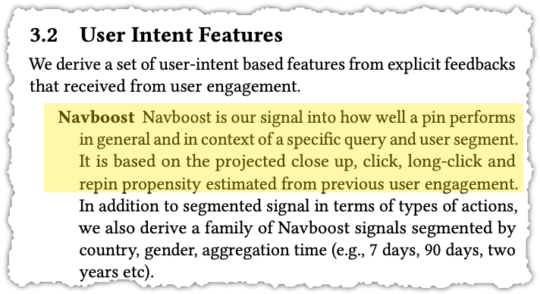
Pinterest paper with Navboost excerpt

Pinterest paper describing Navboost

The COEC model is well-documented with this calculation excerpt from a Yahoo! paper (pdf).
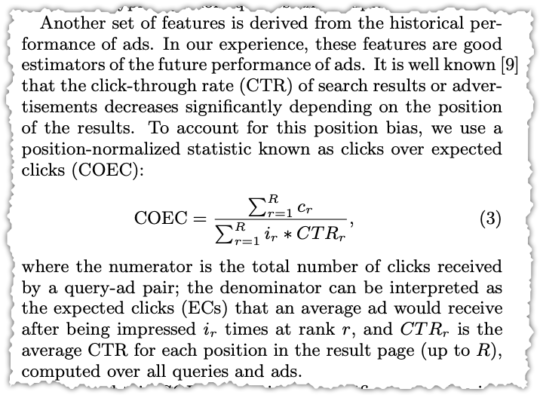
COEC calculation as seen in a Yahoo paper

The calculation looks daunting but the general idea behind Navboost is to provide a boost to documents that generate higher clicks over expected clicks (COEC). So if you were ranked fourth for a term and the expected click rate was x and you were getting x + 15% you might wind up getting a ranking boost.

The final pieces, which puts an end to the debate, come from antitrust trial exhibits that include a number of internal Google presentations.

The first is Google presentation: Life of a Click (user-interaction) (May 15, 2017) (pdf) by former Googler Eric Lehman.
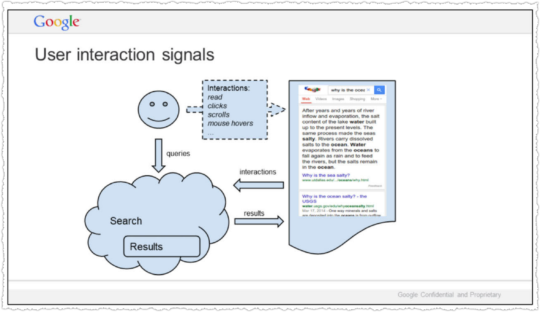
User interaction signals in Google search

What’s crazy is that we don’t actually understand documents. Beyond some basic stuff, we hardly look at documents. We look at people. If a document gets a positive reaction, we figure it is good. If the reaction is negative, it is probably bad. Grossly simplified, this is the source of Google’s magic.

Yes, Google tracks all user interactions to better understand human value judgements on documents.

Another exhibit, Google presentation: Google is magical. (October 30, 2017) (pdf) is more concise.
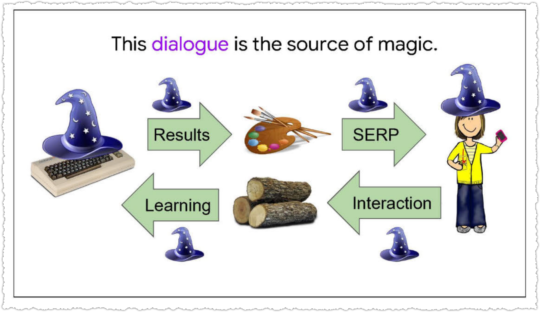
Google magic is the dialogue between results and users

The source of Google’s magic is this two-way dialogue with users.

Google presentation: Q4 Search All Hands (Dec. 8, 2016) goes into more depth.
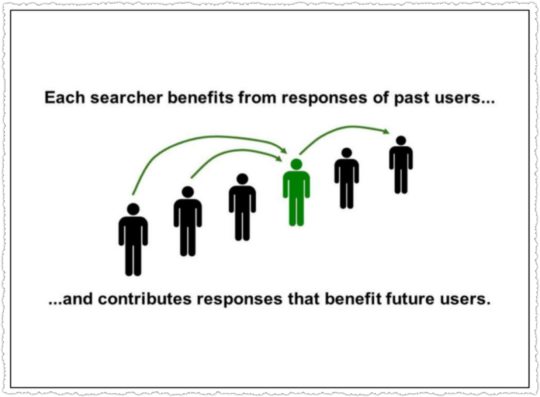
Google search works by induction

SO… if you search right now, you’ll benefit from the billions of past user interactions we’ve recorded. And your responses will benefit people who come after you. Search keeps working by induction.

This has an important implication. In designing user experiences, SERVING the user is NOT ENOUGH. We have to design interactions that also allow us to LEARN from users.

Because that is how we serve the next person, keep the induction rolling, and sustain the illusion that we understand.

The aggregate evaluations of prior user interactions help current search users who pass along their aggregate user interactions to future search users.

Perhaps the most important exhibit in this context is Google presentation: Logging & Ranking (May 8, 2020) (pdf)
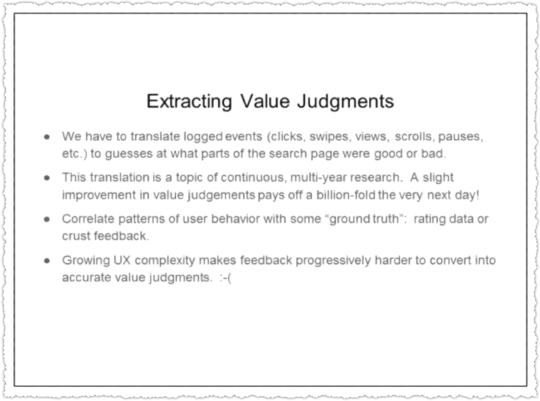
Slide about logging and ranking that talks about extracting value judgments

Within that deck we get the following passages.

The logs do not contain explicit value judgments– this was a good search results, this was a bad one. So we have to some how translate the user behaviors that are logged into value judgments.

And the translation is really tricky, a problem that people have worked on pretty steadily for more than 15 years. People work on it because value judgements are the foundation of Google search.

If we can squeeze a fraction of a bit more meaning out of a session, then we get like a billion times that the very next day.

The basic game is that you start with a small amount of ‘ground truth’ data that says this thing on the search page is good, this is bad, this is better than that. Then you look at all the associated user behaviors, and say, “Ah, this is what a user does with a good thing! This is what a user does with a bad thing! This is how a user shows preference!’

Of course, people are different and erratic. So all we get is statistical correlations, nothing really reliable.

I find this section compelling because making value judgments on user behavior is hard. I am reminded of Good Abandonment in Mobile and PC Internet Search one of my favorite Google papers by Scott Huffman, that determined that some types of search abandonment were good and not bad.

Finally, we find that these user logs are still the fuel for many modern ranking signals.

As I mentioned, not one system, but a great many within ranking are built on logs.

This isn’t just traditional systems, like the one I showed you earlier, but also the most cutting-edge machine learning systems, many of which we’ve announced externally– RankBrain, RankEmbed, and DeepRank.

RankBrain in particular is a powerful signal, often cited as the third most impactful signal in search rankings.

Boosting results based on user feedback and preference seems natural to me. But this assumes that all sides of the ecosystem – platform, sites and users – are aligned.

Increasingly, they are not.

Experts on Everything

Whether you believe my explanation for why brands are ranking so well, it’s happening. In fact, a growing number of brands realize they can rank for nearly anything, even if it is outside of their traditional subject expertise.

I don’t exactly blame these brands for taking this approach. They’re optimizing based on the current search ecosystem. It’s not what I recommend to clients but I can understand why they’re doing it. In other words, don’t hate the player, hate the game.

With that out of the way, I’ll pick on Forbes.

Published eight times a year, Forbes features articles on finance, industry, investing, and marketing topics. It also reports on related subjects such as technology, communications, science, politics, and law.

Funny, I don’t see health in that description. But that doesn’t stop Forbes from cranking out supplement content.

Need some pep for your sex drive? Forbes is goog enough!
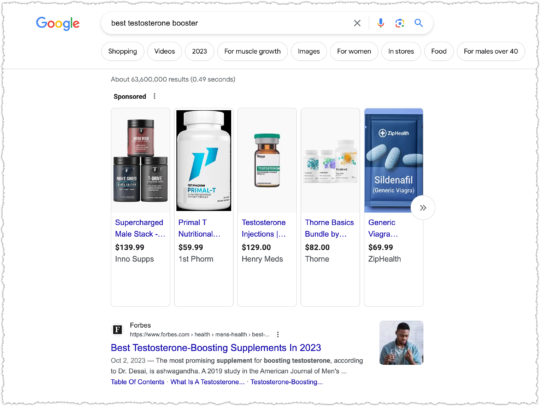
Google search result for best testosterone booster

Need a good rest? Forbes is goog enough!

Google search results for best mattresses 2023

Got a pet that sheds? Forbes is goog enough.
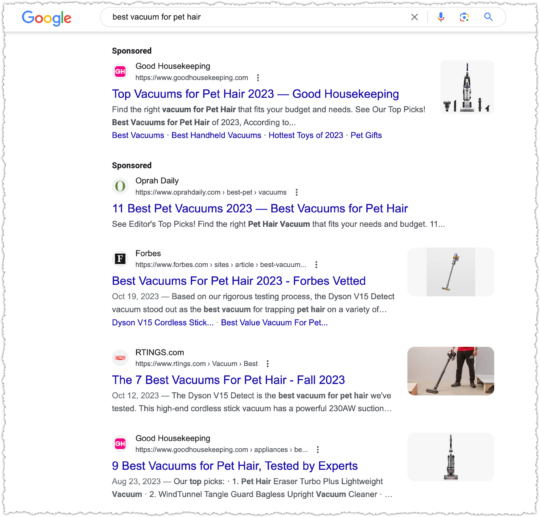
Google search results for best vacuum for pet hair

Or maybe you’re looking for a free VPN? Forbes? Goog enough!
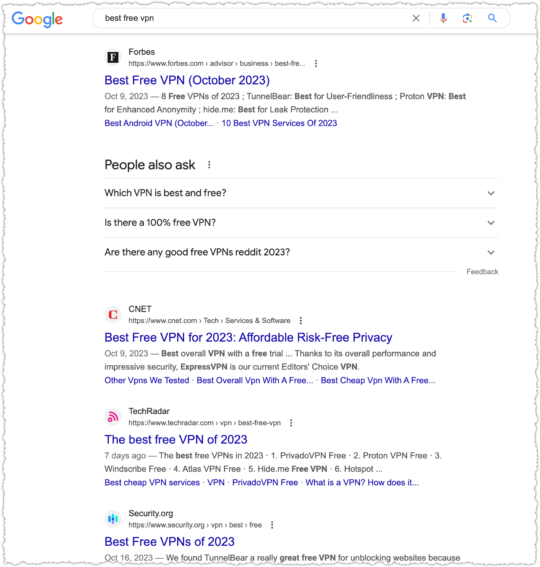
Google search results for best free vpn

Now this is, at least, technology adjacent, which is in their related topics description in Wikipedia. But does anyone really think Forbes has the best advice on free VPN?

Forbes still works under a contributor model, which means you’re never quite sure as to the expertise of the writer and why that content is being produced other than ego and getting ad clicks. (I mean, you have to be a click ninja to dodge the ads and read anything on the site anyway.)

It’s not just me that thinks this model produces marginal content. An incomplete history of Forbes.com as a platform for scams, grift, and bad journalism by Joshua Benton says it far far better than I could.

And unlike a bunch of those folks on Forbes, Joshua has the writing chops.

Bio for Joshua Benton

Perhaps the most notable gaffe was having Heather R. Morgan (aka – Razzlekhan) write about cybersecurity when she was guilty of attempting to launder $4.5 billion of stolen bitcoin.

But regular people still have a positive brand association with Forbes. They don’t know about the contributor model or the number of times it’s been abused.

So they click on it. A lot. Google notices these clicks and boosts it in rankings and then more people click on it. A lot.
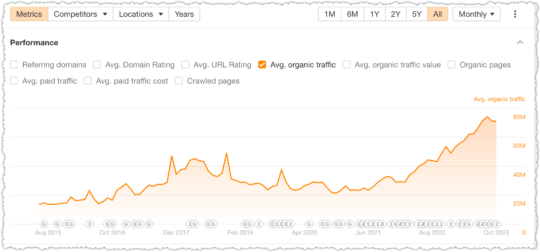
ahrefs graph of organic traffic to Forbes

The result is, according to ahrefs, a little over 70MM in organic traffic each month.

Forbes isn’t the only one doing this, though they might be the most successful.

When you’re looking for the best body scrub you naturally think of … CNN?
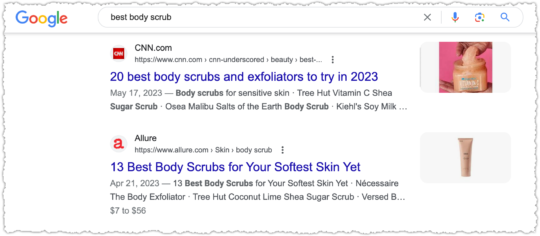
Google search results for best body scrub

Goog enough!

Or maybe you’ve caught this round of COVID and you need a thermometer.
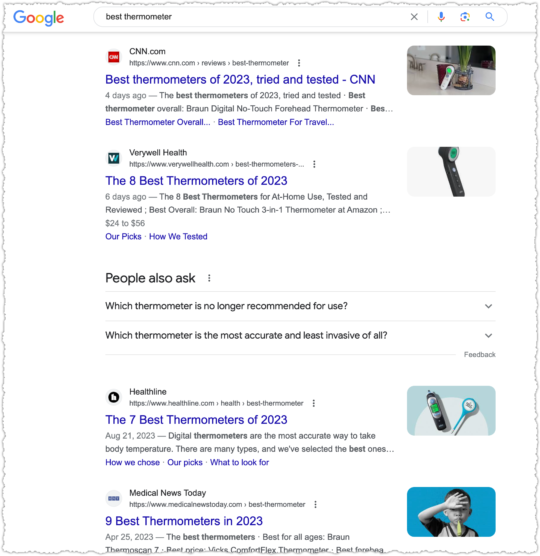
Google search results for best themometer

Silly health sites. CNN is goog enough!

All of this runs through the /cnn-underscored/ folder on CNN, which is essentially a microsite designed to rank for and monetize search traffic via affiliate links. It seems modeled after The New York Times and its Wirecutter content.

There are plenty of others I can pick on including Time and MarketWatch. But I’ll only pick on one more: U.S. News & World Report.

Looking for the best HVAC system?
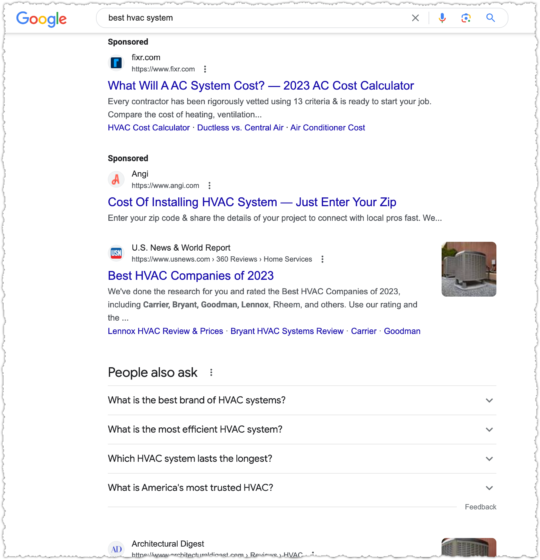
Google search results for best HVAC system

U.S. News is goog enough!

When it comes to cooking though, some sort of recipe or food site has to be ranking right?
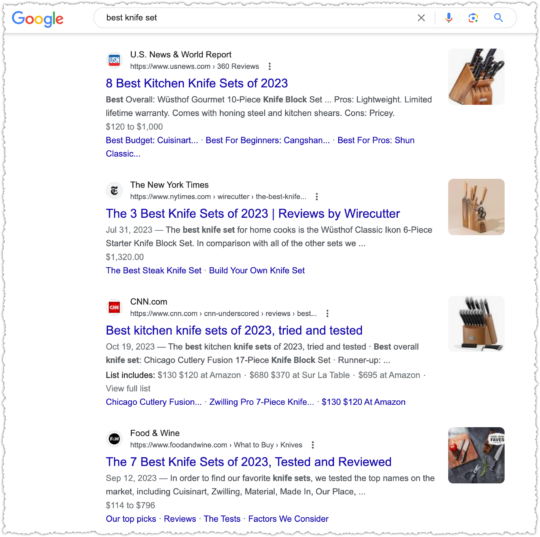
Google search results for best knife set

Naw, U.S. News is goog enough!

U.S. News takes it a step further when they get serious about a vertical. They launch subdomains with, by and large, content from third-parties. Or as they are prone to doing, taking third-party data and weighting it to create rankings.

You might have heard about some of the issues surrounding their College Rankings. Suffice to say, I find it hard to believe U.S. News is the very best result across multiple verticals, which includes, cars, money, health, real estate and travel.

At this point you know the refrain. In most cases, it’s goog enough!
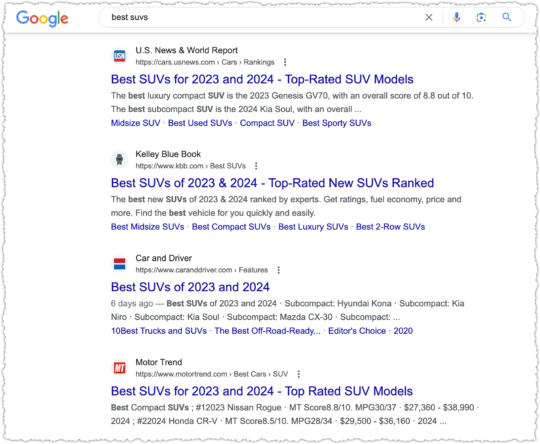
Google search results for best suvs

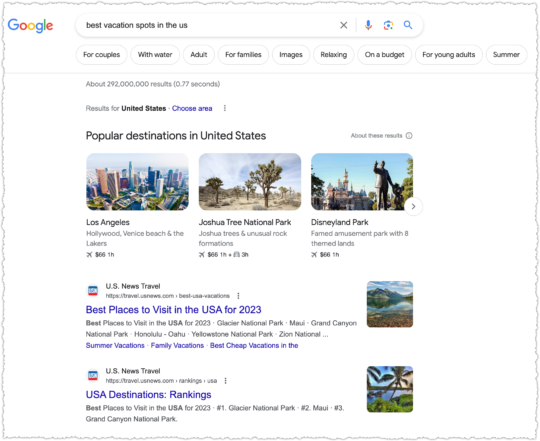
Google search results for best vacation spots in the us

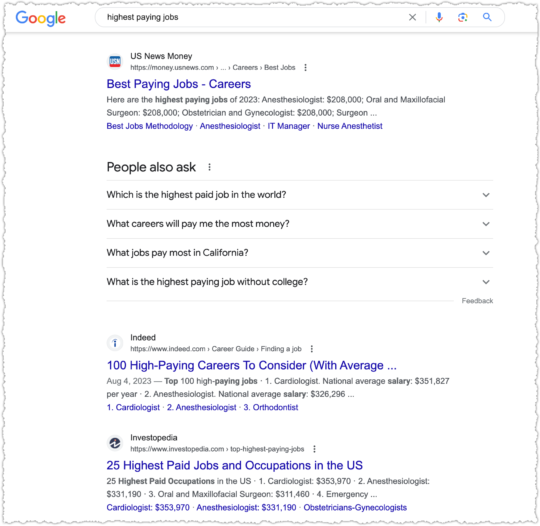
Google search results for highest paying jobs

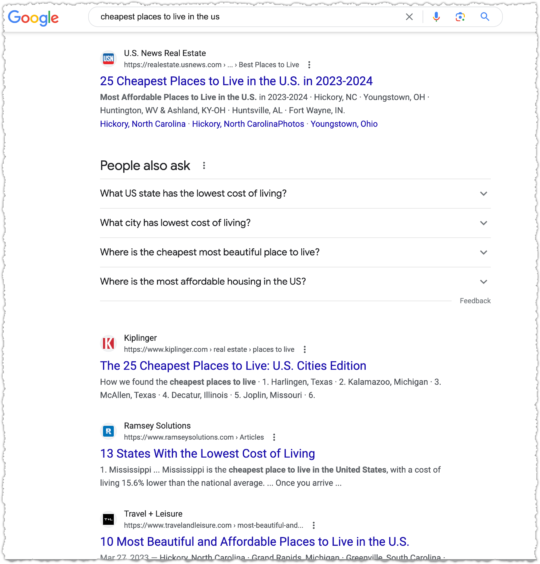
Google results or cheapest places to live in the us

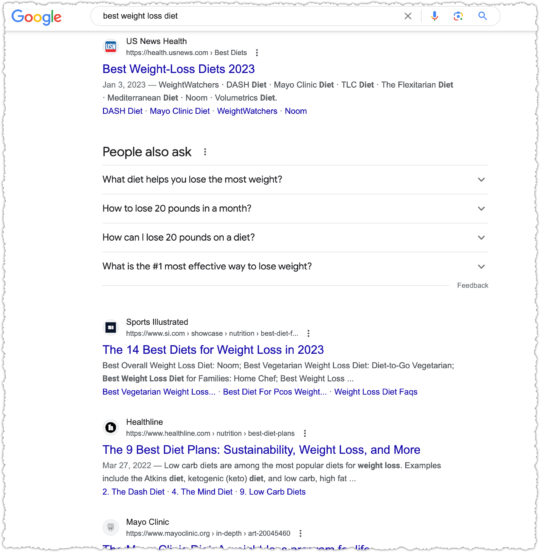
Google search results for best weight loss diet

Google search results for best medical alert system

At least in this last one The National Council on Aging is ahead of U.S. News. But they aren’t always and I fail to see why it should be this close.

Unintended Consequences

The over reliance on brand also creates sub-optimal results outside of those hustling for ad and affiliate clicks.
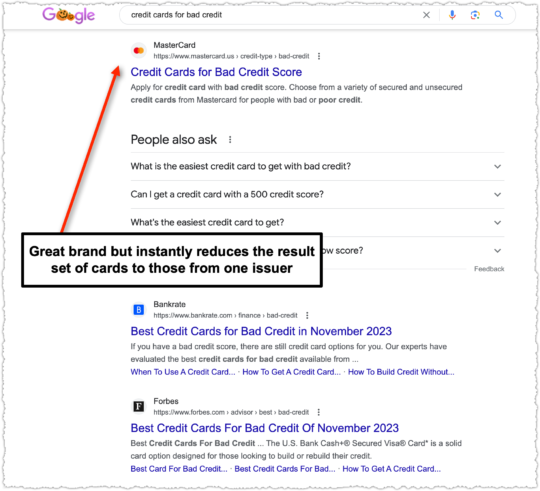
Google search results for credit cards for bad credit

Here MasterCard is ranking for a non-branded credit card query. MasterCard is clearly a reputable and trusted brand within this space. But this is automatically a sub-optimal result for users because it excludes cards from other issuers like Visa and Discover.

It gets worse if you know a bit about this vertical. When you click through to that MasterCard page you’re not provided any information to make an informed decision.

MasterCard page for credit cards for bad credit

Why isn’t MasterCard showing the rates and fees for these cards?
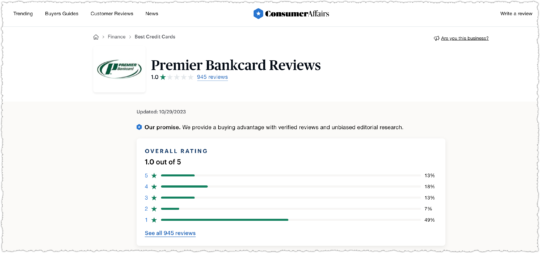
Premier Bankcard reviews on Consumer Affairs

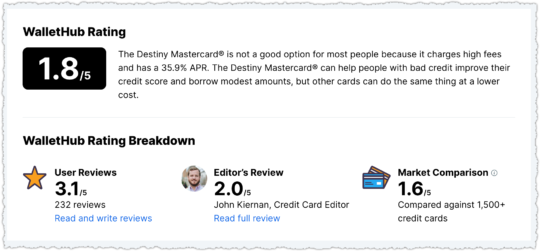
Destiny MasterCard review on WalletHub

In short, those cards are pretty dreadful for consumers, particularly consumers who are in a vulnerable financial position. And the rate and fee information is available as you can see in the WalletHub example. There are better options available but users may blindly trust the MasterCard result due to brand affinity.

A lot of the terms I’ve chosen revolve around the ‘best’ modifier, which is in many ways a proxy for review intent. And reviews are a bit of a bugaboo for Google over the last few years. They even created a reviews system to address the problem. Yet, we still get results for review queries where the site or product itself is ranking.
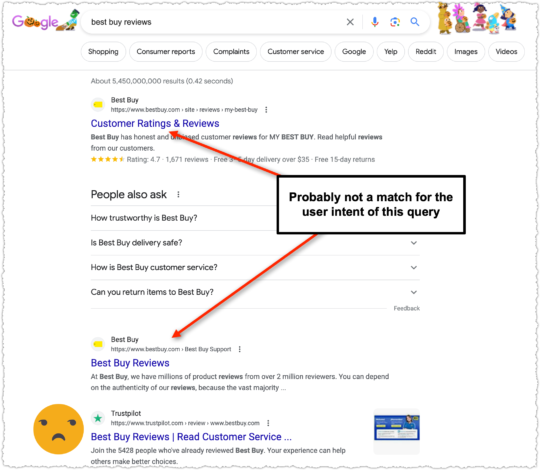
Google search results for best buy reviews

If I’m looking for reviews about a site or product I’m not inclined to believe the reviews from that site. It’s like getting an alibi from your spouse.

The thing is, I get why Best Buy is trying so hard to rank well for this term. Because right below them is TrustPilot.

Weaponized SEO

What’s the problem with TrustPilot? Well, let me tell you. The way their business model works is by ranking for a ‘[company/site] reviews’ term with a bunch of bad reviews and a low rating.

Once TrustPilot ranks well (usually first) for that term, it does some outreach to the company. The pitch? They can help turn that bad rating into a good one for a monthly fee.

If you pay, good reviews roll in and that low rating turns around in a jiffy. Now when users search for reviews of your company they’ll know you’re just aces!

One of the better examples of this is Network Solutions, a company that a friend of mine has written about in great detail. Using the Internet Archive you can see that Network Solutions had terrible ratings on TrustPilot as of January 2022 when they were not a customer.
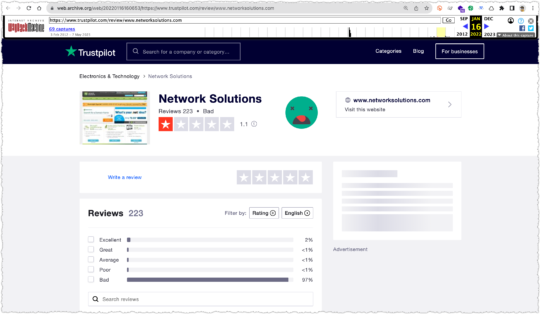
Internet Archive capture of TrustPilot page for Network Solutions from January 2022

By December 2022 Network Solutions had become a customer (i.e. – verified company) and secured a rating of 4.3.
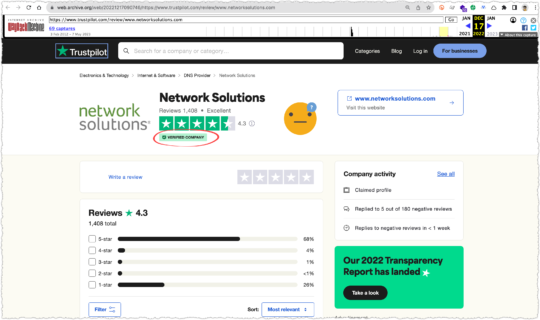
Internet Archive from December 2022 of Network Solutions on TrustPilot

Some of you might be keen enough to look at the distribution of ratings and wonder how Network Solutions can have a 4.3 rating with 26% of the total being 1.0.

A simple weighting of the ratings would return a 3.87.

(5*.68)+(4*.04)+(3*.01)+(2*.01)+(1*.26) = 3.87

But if you hover over that little (i) next to the rating you find out they don’t use a simple average.
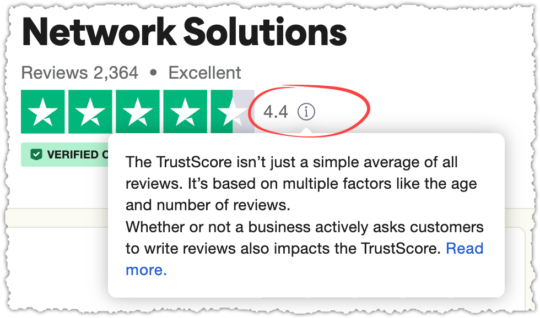
TrustPilot rating disclaimer

Following that link you can read how TrustScore is calculated. I have to say, I’m grudgingly impressed in an evil genius type of way.

  • Time span. A TrustScore gives more weight to newer reviews, and less to older ones. The most recent review holds the most weight, since newer reviews give more insight into current customer satisfaction.

  • Frequency. Businesses should continuously collect reviews to maintain their TrustScore. Because the most recent review holds the most weight, a TrustScore will be more stable if reviews are coming in regularly.

So all the bad reviews and ratings they collected to rank and strong arm businesses can be quickly swept away based on review recency. And all you have to do to keep your ratings high is to keep using their product. Slow clap.

I would bet customers have no idea this is how ratings are calculated. Nor do they understand, or likely care, about how TrustPilot uses search to create a problem their product solves. But TrustPilot looks … trustworthy. Heck, trust is in their name!

Now a company is likely neither as bad before nor as good after they become a TrustPilot customer. There is ballot box stuffing on both sides of the equation. But it’s unsettling that reddit is awash in complaints about TrustPilot.

Ugly truth behind TrustPilot Reviews contains the following comment:

I tried to leave a bad review on Trustpilot once, but the business was given an opportunity to protest before my review was published. TP demanded proof of my complaint. I provided an email chain but the business kept arguing nonsense and TP defaults to taking their side. The review was never posted. I’ve assumed since then that the site is completely useless because businesses seem to be able to complain until reviews get scrubbed.

Finding out that Trustpilot is absolutely NOT trustworthy! contains the following comment:

I complained about an insurance company who failed to look for the other party in an accident, failed to sort out the courtesy car, and didn’t call us or write to us when they said they would in a review. The company complained and TrustPilot took it down. I complained and TrustPilot asked me to provide evidence of these things that didn’t happen. I asked them what evidence of nonexistent events would satisfy them and they said it was up to me to work that out.

Fake Trustpilot review damaging my business contains the following comment:

I would just add, Trustpilot is a tax on businesses. It ruined my business because, usually, only unhappy people leave a review unsolicited. However, if you pay Trustpilot, they’ll send review requests to every customer and even sort you out with their special CMS.

So why do I have such a bee in the bonnet about TrustPilot and what does it have to do with search? The obvious issue is that TrustPilot uses a negative search result to create a need for their product.

It’s a mafia style protection racket. “Too bad about those broken windows” says the thug as they smash the glass. “But I think I can help you fix that.”

Let me be clear, I’d have little to no problem with TrustPilot if they were simply selling a product that helped companies deliver reviews to other platforms like Yelp or the Play Store.

The second reason is that a large number of people trust these ratings without knowing the details. I’m concerned that any ranking signal that is using click preference will be similarly trained.

The last reason is that Google has been rightly cracking down on the raft of MFA (Made for Adsense/Amazon) review sites that offered very little in the way of value to users. It was easy to ferret out these small spammy sites all with the same lists of products that would deliver the highest affiliate revenue.

Google got rid of all the corner dealers but they left the crime bosses alone.

I could paint a much darker portrait though. Google is simply a mirror.

Users were more prone to finger those scraggly corner dealers but are duped by the well dressed con man.

The Dark Forest

By now you’re probably sick and tired of search result screenshots and trying to determine the validity, size and scope of these problems.

I know I am. It’s exhausting and a bit depressing. What if this fatigue is happening when people are performing real Google searches?

Enter the Dark Forest Theory.
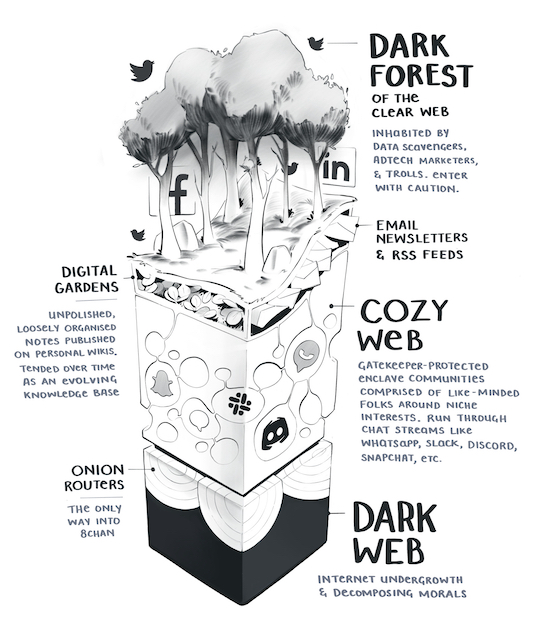
Dark Forest illustration by Maggie Appleton

Illustration Credit: Maggie Appleton

In May of 2019 Yancey Strickler wrote The Dark Forest Theory of the Internet. I was probably late to reading it but ever since I did it’s been rattling around in my head.

In response to the ads, the tracking, the trolling, the hype, and other predatory behaviors, we’re retreating to our dark forests of the internet, and away from the mainstream.

Dark forests like newsletters and podcasts are growing areas of activity. As are other dark forests, like Slack channels, private Instagrams, invite-only message boards, text groups, Snapchat, WeChat, and on and on.

This is the atmosphere of the mainstream web today: a relentless competition for power. As this competition has grown in size and ferocity, an increasing number of the population has scurried into their dark forests to avoid the fray.

These are some of the passages that explained the idea of a retreat away from mainstream platforms. And while search isn’t mentioned specifically, I couldn’t help but think that a similar departure might be taking place.

Then Maggie Appleton did just that with The Expanding Dark Forest and Generative AI. It’s a compelling piece with a number of insightful passages.

You thought the first page of Google was bunk before? You haven’t seen Google where SEO optimizer bros pump out billions of perfectly coherent but predictably dull informational articles for every longtail keyword combination under the sun.

We’re about to drown in a sea of pedestrian takes. An explosion of noise that will drown out any signal. Goodbye to finding original human insights or authentic connections under that pile of cruft.

Many people will say we already live in this reality. We’ve already become skilled at sifting through unhelpful piles of “optimised content” designed to gather clicks and advertising impressions.

Are people really scurrying away from the dark forest of search?

In February, Substack reported 20 million monthly active subscribers and 2 million paid subscriptions. (And boy howdy do I like the tone of that entire post!)

Before Slack was scarfed up by Salesforce it had at least 10 million DAU and was posting a 39% increase in paid customers. In retrospect, I recently used a Slack channel to better research rank tracking options because search results were goog enough but ultimately unhelpful.

Discord has 150 million MAU and 4 billion daily server conversation minutes. While it began as a community supporting gamers, it’s moved well beyond that niche.

I also have a running Signal conversation with a few friends where we share the TV shows we’re watching and help each other through business and personal issues.

It’s hard to quantify the impact of these platforms. It reminds me a lot of the Dark Social piece by Alexis Madrigal. Perhaps we’ve entered an era of dark search?

But a more well documented reaction has been the practice of appending the word ‘reddit’ to search queries. All of those pieces were from 2022. Today Google is surfacing reddit far more often in search results.
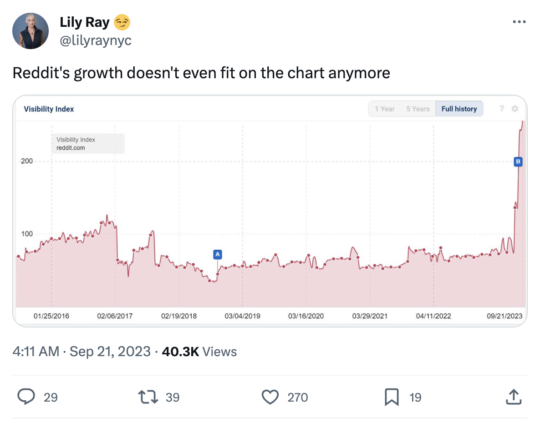
Post by Lily Ray on Former Bird Site that shows visibility of reddit over time

I’m not mad about this, unlike many other SEOs, because I think there is a lot of authentic and valuable content on reddit. It deserves to get more oxygen. (Disclaimer: reddit is one of my clients.)

Yet, I can’t help but think that Google addressed a symptom and not the cause.

Google took the qualitative (screeds by people that wound up on Hacker News) and quantitative (prevalence of reddit as a query modifier) and came to the conclusion that people simply wanted more reddit in their results.

Really, the cause of that reddit modifier was dissatisfaction with the search results. It’s an expression of the dark forest. They were simply detailing their work around. (It may also be a dissatisfaction with reddit’s internal search with people using Google by proxy to search reddit instead.)

Either way, at the end of the day, the main culprit is with search quality. And as I have shown above and as Maggie has pointedly stated, the results aren’t great.

They’re just goog enough.

Mix Shift

If people are running away from the dark forest, who is left to provide click data to these powerful signals. The last part of Yancey’s piece says it well.

The meaning and tone of these platforms changes with who uses them. What kind of bowling alley it is depends on who goes there.

Should a significant percentage of the population abandon these spaces, that will leave nearly as many eyeballs for those who are left to influence, and limit the influence of those who departed on the larger world they still live in.

If the dark forest isn’t dangerous already, these departures might ensure it will be.

Again, Yancey is talking more about social platforms but could a shift in the type of people using search change the click data in meaningful ways? A mix shift can produce very different results.

This even happens when looking at aggregate Google Search Console data. A client will ask how search impressions can go up but average rank go down. The answer is usually a page newly ranking at the bottom of the first page for a very high volume query.

It’s not magic. It’s just math.

The maturity of search and these defections can be seen on the Diffusion of Innovation Curve.
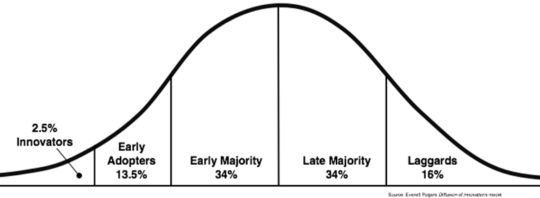
Rogers Diffusion of Innovation Curve

Google search is well into the laggards at this point. Your grandma is searching! Google has achieved full market saturation.

In the past, when people complained about Google search quality, I felt they were outliers. They might be SEOs or technologists, both highly biased groups that often have an ax to grind. They were likely in the Innovators category.

But 20 million Substack subscribers, Discord usage, the sustained growth of DuckDuckGo and Google’s own worries over Amazon, Instagram and TikTok makes it feel different this time. The defections from the dark forest aren’t isolated and likely come from both Early Adopters and Early Majority.

Google is learning from user interactions and those interactions are now generated by a different mix of individuals. The people who used Google in 2008 are different from those who use Google today.

If Google is simply a mirror, whose face are we seeing?

Information Asymmetry

Asymmetrical haircut on Fleabag

Many of the examples I’m using above deal with the exploitation of information asymmetry.

Information asymmetry refers to a situation where one party in a transaction or interaction possesses more or better information compared to the other party. This disparity in knowledge can create an environment in which the party with more information can exploit their advantage to deceive or mislead the other, potentially leading to fraudulent activities.

Most users are unaware of the issues with the Forbes contributor model or how TrustPilot collects reviews and calculates rankings. It’s not that content explaining these things doesn’t exist. They do. But they are not prominently featured and are often wrapped in a healthy dose of marketing.

So users have to share some of the blame. Should Your Best Customers be Stupid? puts it rather bluntly.

Whether someone’s selling a data plan for a device, a retirement plan to a couple, or a surgical procedure to an ailing child’s parents, it’s unlikely that “smart” customers will prove equally profitable as “stupid” ones. Quite the contrary, customer and client segmentation based on “information asymmetries” and “smarts” strikes me as central to the future of most business models.

Is the current mix of search users less savvy about assessing content? Or in the context of the above, are the remaining search users stupid?

Sadly, the SEO industry is a classic example of information asymmetry. Most business owners and sites have very little idea of how search works or the difference between good and bad recommendations.

The reputation of SEOs as content goblins and spammers is due to the large number of people charging a mint for generic advice and white-label SEO tool reports with little added value.

Information asymmetry is baked into search. You search to find out information from other sources. So information asymmetry widens any time the information from those sources is manipulated or misrepresented.

Incentive Misalignment
Brodie from the Wire

Let’s return to those divisive U.S. News College Rankings. It parallels an ecosystem in which the incentives of parties aren’t aligned. In this instance, U.S. News wants to sell ads and colleges want to increase admissions, while prospective students are simply looking for the best information.

The problem here is that both U.S. News and colleges have economic incentives increasingly misaligned with student informational needs. While economic incentives can be aligned with informational needs, they can be compromised when the information asymmetry between them widens.

In this instance, U.S. News simply became the source of truth for college rankings and colleges worked to game those rankings. Students became reliant on one source that was increasingly gamed by colleges.

The information asymmetry grows because of the high degree of trust (perhaps misplaced) students have in both U.S. News and colleges. Unaware of the changes to information asymmetry, students continued to behave as if the incentives were still aligned.

Now go back and replace U.S. News with Google, colleges with sites (like Forbes or CNN) and students with search users.

Enshittification

Cory Doctorow has turned enshittification into a bit of an Internet meme. The premise of enshittification is that platforms are doomed to ruin their product as they continue to extract value from them.

Here is how platforms die: first, they are good to their users; then they abuse their users to make things better for their business customers; finally, they abuse those business customers to claw back all the value for themselves. Then, they die.

I think one of his better references is from the 1998 paper The Anatomy of a Search Engine by two gents you might recognize: Sergey Brin and Larry Page.

… we expect that advertising funded search engines will be inherently biased towards the advertisers and away from the needs of the consumers.

The entire section under Appendix A: Advertising and Mixed Motives essentially makes the case for the dangers of incentive misalignment. So if you don’t believe me, maybe you’ll believe the guys who created Google.

But we don’t really have to believe anything. We have data to back this up.

Ad Creep

There is no shortage of posts about the increasing prevalence of ads on search results.

Google search results for wake forest university student loan comparison tool

Photo Credit: u/subject_cockroach636 via reddit

Anecdotes are easy to brush off as outliers and whiners. But, as they say, we have receipts.

In 2020, Dr. Pete Myers found that the #1 organic result started 616px down the page versus 375px in 2013. That’s a 64% increase.

But what about since 2020?

Nozzle.io shows that the percentage of space above the fold with a traditional ‘blue link’ decreased steeply at the end of 2021.
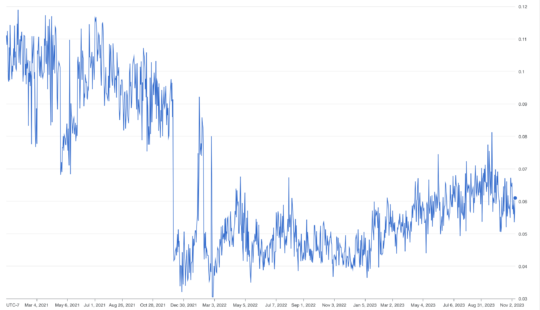
Percent of terms tracked by Nozzle where organic had a result above the fold

Nozzle takes the standard top of fold metric and looks at how much pixel space is dedicated to a true organic result.
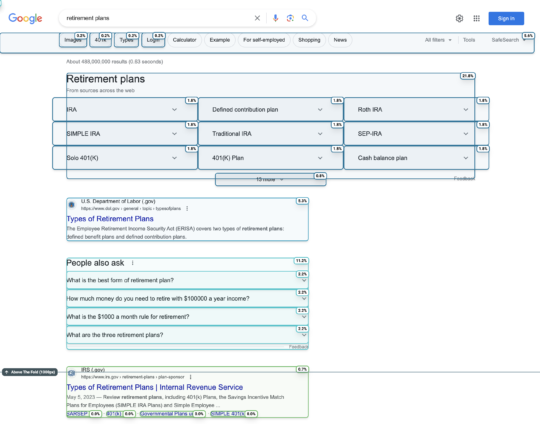
Pixel analysis of a SERP from Nozzle

It’s not always an ad as you can see above. But the fact remains that standard organic results are seeing less and less real estate going from ~11% to ~6% today.

SEOClarity has different methodology but shows an increasing lack of opportunity to rank organically above the fold.

First fold ranking opportunity graph from SEOClarity

That’s from ~7% in October of 2021 to ~31% in October of 2023.

SEOClarity also shows the creep of product packs on mobile devices. 
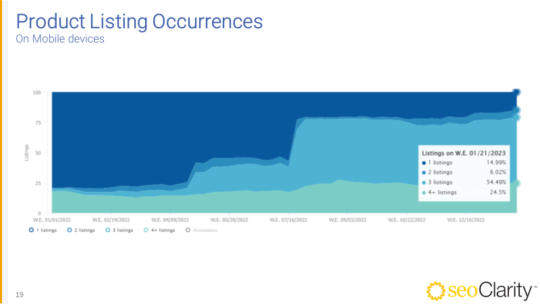
Number of product listings on mobile devices via SEOClarity

Here we see the expansion of product packs over the course of 2022, with an explosion of growth that ended with 79% SERPs with 3+ product packs.

You encounter these as you continue to scroll through a search result. Many wind up being unpaid listings but a simple label could turn any of these into a sponsored feature. And there are so many of them on search results today.

Those product units? They’re also getting bigger. The products unit increased by 34% from 2021 to present.
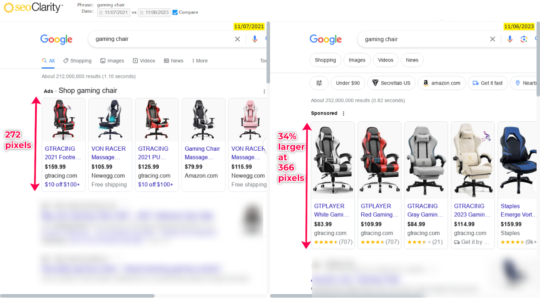
Product unit height has increased via SEOClarity

Nozzle confirms the compounding nature of this issue by doing a pixel analysis of the entire SERP. It shows that products have seen a 600% increase in SERP real estate from ~1% to ~6% today.
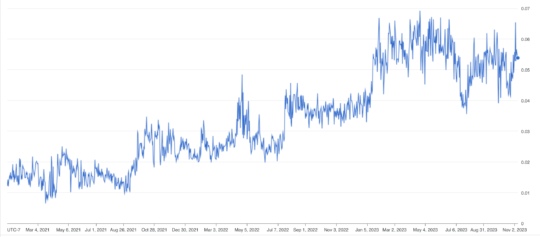
Pixel percentage of SERPs for products via Nozzle

And in a 100K sample tracking by SEOClarity we can see the prevalence of Shopping Ads specifically has increased.

Shopping ads occurrence on ecommerce terms graph from SEOClarity

Of course you can see the spikes for the end of the year shopping spree but this year it’s like they just kept it on full blast.

And now they’re even testing putting ads in the middle of organic search results!

This seems like a pretty classic case of enshittification and what Google’s own founders cautioned against.

Context Switching and Cognitive Strain

The straw that might have broken the camel’s back and why this post exists is the decision by Google to remove indented results from search results.

I know, crazy right?

Now, for those not in the know, when a site had two or more results for a query Google would group them together, indenting the additional results from the same site. This was a great UX convention, allowing users to sort similar information and select the best from that group before moving on to other results.

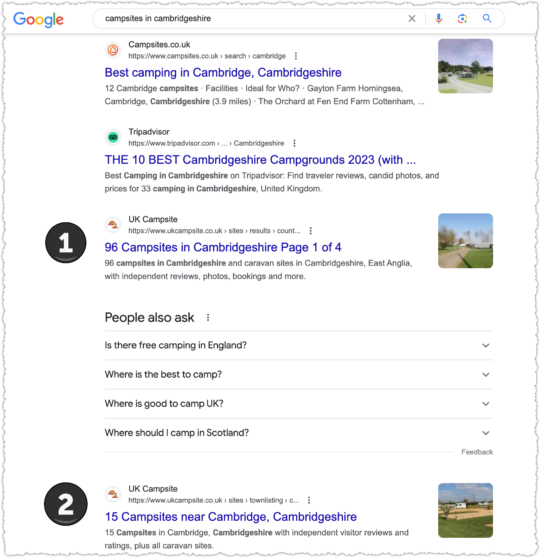
But now that indentation is gone. But it gets worse! Google isn’t even keeping results from the same site together anymore. You wind up with search results where you could encounter the same site twice or more but not consecutively.
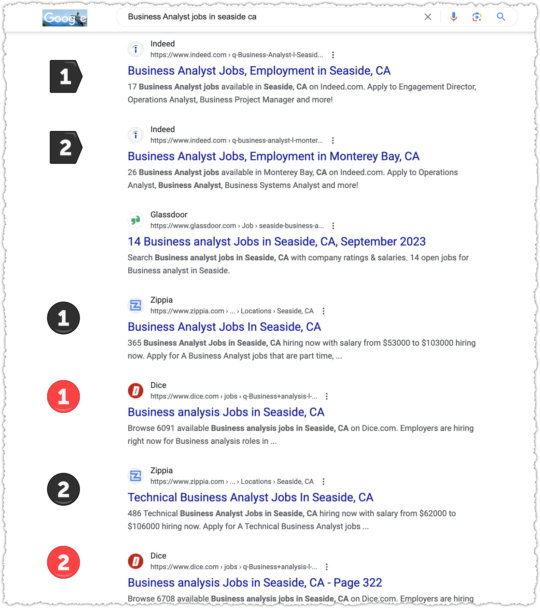
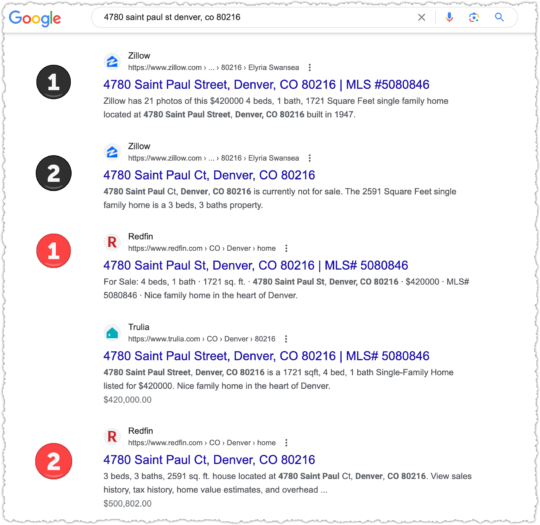
Google search results for business analyst jobs in seaside ca

Google search results for an address search

Google search results for campsites in cambridgeshire

I guess it’s goog enough for users.

But is it really? Let’s use an offline analogy and pretend I’m making fruit salad.

I go to the store and visit the produce section. There I find each type of fruit in a separate bin. Apples in one, oranges in another so on and so forth. I can quickly and easily find the best of each fruit to include in my salad. That is the equivalent of what search results are like with indented results.

Produce section with sorted fruit

Photo Credit: Shutterstock

Without indented results? I’d go to the store and visit the produce section where I’d find one gigantic bin with all the fruit mixed together. I have to look at an apple, find it’s not what I’m looking for, then find an orange I like, then look at a pear, then find another orange that I don’t need because I already found one, then another pear, then another orange I don’t need, then a pineapple.

I’m sorry, but in no world is this a good user experience. It’s such a foreign concept I gave up getting DALL-E to render a mixed up produce aisle.

Clutter

Do search results spark joy? There is no question that search results have become cluttered. Even as something as simple as a t-shirt query.
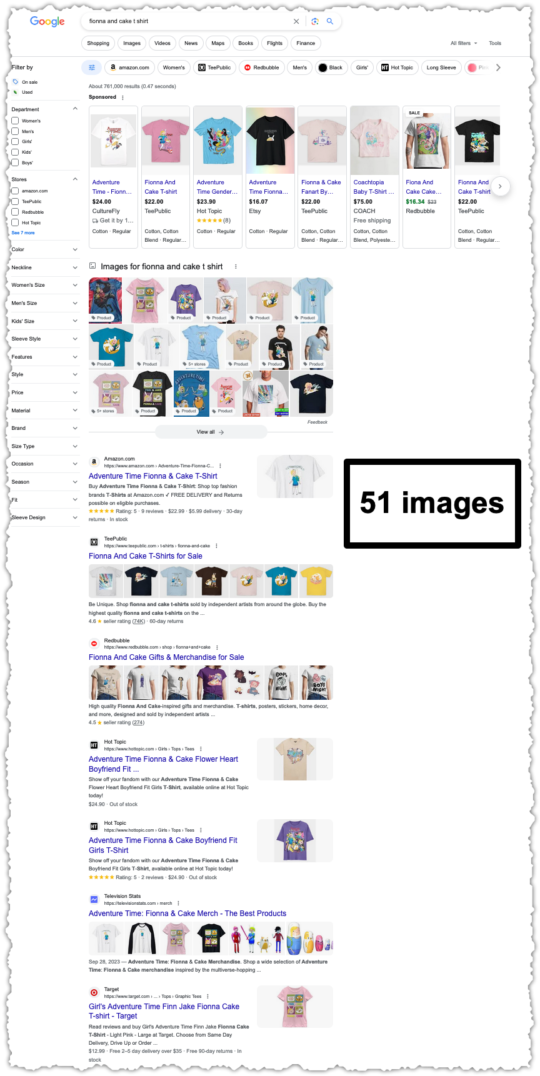
Google search results for fionna and cake t shirt

There are 51 individual images pictured above. I understand the desire to make results more visual. But this strikes me as a kitchen sink approach that may run afoul of The Paradox of Choice. And this example is just the tip of the iceberg.

Even Google agrees and has started to sunset SERP features.

To provide a cleaner and more consistent search experience, we’re changing how some rich results types are shown in Google’s search results. In particular, we’re reducing the visibility of FAQ rich results, and limiting How-To rich results to desktop devices. This change should finish rolling out globally within the next week.

All of these UX changes have a material impact on the evaluation of interaction data. Google says it best.

Growing UX complexity makes feedback progressively harder to convert into accurate value judgments :-(

You know what hasn’t changed? People’s affinity for brands. So if other user interaction data is becoming harder to parse given the UX complexity does the weight of less complex user interaction data (such as Navboost) grow as a result?

Google Org Structure

Why does it all feel different now? Some of it may be structural.

Amit Singhal was the head of Google search from 2001 until 2016, when he departed under controversy. These were the formative years of Google and is the search engine I certainly think of and identify with when I think of Google.

Following Singhal was John Giannandrea, who employed an AI first approach. His tenure seemed rocky and ended quickly when Giannandrea was hired away by Apple in 2018.

Stepping in for Giannandrea was Ben Gomes, a long-time Google engineer who was more closely aligned with the approach Singhal took to search quality. I’ve seen Ben speak a few times and met him once. I found him incredibly smart yet humble and inquisitive at the same time.

But Ben’s time at the top was short. In June of 2020 Ben moved to Google Education, replaced by Prabhakar Raghavan, who had been heading up Google Ads.

Here’s where it gets interesting. When Raghavan took the role he became head of Google Search and Google Ads. It is the first time in Google’s history that one person would oversee both departments. Historically, it was a bit like the division between church and state.

That set off alarm bells in my head as well as others as detailed on Coywolf News.
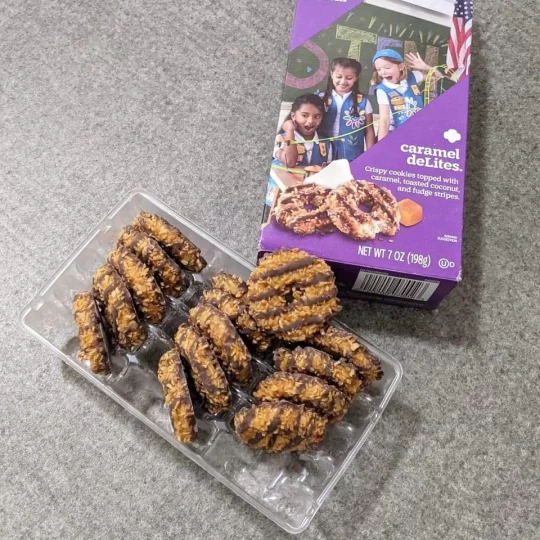
Box of samoas or caramel delites

Photo Credit: u/boo9817 via reddit

Even if your intentions are pure I felt it would be difficult not to give into temptation. It’s like Girl Scout cookies. You can’t have a box of Samoas lying around the house tempting you with their toasted coconut chocolatey-caramel goodness.

Your only defense is to not have them in the house at all. (Make a donation to the Girl Scouts instead.)

But what if you were the Girl Scout leader for that troop? You’ve been working pretty hard for a long time to ensure you can sell a lot of cookies. They’re stacked in your living room. Could that make it even tougher not to indulge?

Email from Benedict Gomes (Google) to Nick Fox (Google), Re: Getting ridiculous.. (Feb. 6, 2019) (pdf) shows the concern Gomes had with search quality getting too close to the money.

I think it is good for us to aspire to query growth and to aspire to more users. But I think we are getting too involved with ads for the good of the product and company

A month later there’s B. Gomes Email to N. Fox, S. Thakur re Ads cy (Mar. 23, 2019) (pdf), which contains an unsent reply to Raghavan that generally explains how Gomes believes search and short-term ad revenue are misaligned. It’s a compelling read.

Yet, a year later Raghavan had the top job. Now this could be an ice cream and shark attacks phenomenon. But either way you slice it, we’ve gotten more ads and a more cluttered SERP under the Raghavan era.

ChatGPT

Simone and Wiley from Mrs. Davis

You thought you could escape a piece on the state of search without talking about generative content? C’mon!

I’m not a fan. Services like ChatGPT are autocomplete on steroids, ultimately functioning more like mansplaining as a service.

They don’t really know what they’re talking about, but they’ll confidently lecture you based on the most generic view of the topic.

What Is ChatGPT Doing … and Why Does It Work? is a long but important read, which makes it clear that you’ll always get the most probable content based on its training corpus.

The loose translation is that you’ll always get the most popular or generic version of that topic.

Make no mistake, publishers are exploring the use of generative AI to create or assist in the writing of articles. Pioneers were CNET, who was in the crosshairs for the use of generative content soon after ChatGPT launched. Fast forward to today and it’s a Gannett site found to be using AI content.

Publishers have clear economic incentives to use generative AI to scale the production of generically bland content while spending less. (Those pesky writers are expensive and frequently talk back!)

I see the flood of this content hitting the Internet bad in two ways for Google search. First, unsophisticated users don’t understand they’re getting mediocre content. They are unaware the content ecosystem has changed, making the information asymmetry a chasm.

More dangerous, sophisticated users may be aware the content ecosystem has changed and will simply go to ChatGPT and similar interfaces for this content. If Google is full of generic results, why not get the same result without the visual clutter and advertising avalanche?

This doesn’t seem far-fetched. ChatGPT was the fastest-growing consumer application in history, reaching 100 million users two months after launch.

Groundhog Day

Groundhog Day Phil Driving

We’ve been here before. I wrote about this topic over 12 years ago in a piece titled Google Search Decline or Elitism?

Google could optimize for better instead of good enough. They could pick fine dining over fast food.

But is that what the ‘user’ wants?

Back then the complaints were leveled at content farms like Mahalo, Squidoo and eHow among others.

Less than a month after I wrote that piece Google did choose to optimize for better instead of goog enough by launching the Panda update. As a result, Mahalo and Squidoo no longer exist and eHow is a shadow of what it once was.

Is ChatGPT content the new Demand Media content farm?

Editorial Responsibility

A recent and rather slanted piece on the Verge did have one insight from Matt Cutts, a former Google engineer who I sorely miss, that struck a chord.

“There were so many true believers at Google in the early days,” Cutts told me. “As companies get big, it gets harder to get things done. Inevitably, people start to think about profit or quarterly numbers.” He claimed that, at least while he was there, search quality always came before financial goals, but he believes that the public underestimates how Google is shaping what they see, saying, “I deeply, deeply, deeply believe search engines are newspaper-like entities, making editorial decisions.”

The last sentence really hits home. Because even if I have the reasons for Forbes, CNN, U.S. News and others ranking wrong, they are ranking. One way or the other, that is the editorial decision Google is making today.

If my theory that Google is relying too much on brands through user preference is right, then they’re essentially abdicating that editorial decision.

They’re letting the inmates run the asylum.

Food Court Search Results

Shopping mall food court

Photo Credit: Shutterstock

Any user interaction data from a system this broken will become increasingly unreliable. So it’s no surprise we’re seeing a simulacrum of content, a landscape full of mediocre content that might seem tasty but isn’t nutritional.

Search results are becoming the equivalent of a shopping mall food court. Dark forest migrants avoid the shopping mall altogether while those that remain must choose between the same fast food chains: Taco Bell, Sbarro, Panda Express, Subway and Starbucks.

You won’t get the best meal or coffee when visiting these places but it’s consistently … okay.

It’s goog enough!

From Goog Enough To Great

So how could Google address the yawning information asymmetry and incentive misalignment responsible for goog enough results? There’s no doubt they can. They have incredibly talented individuals who can tackle these issues in ways far more sophisticated than I’m about to suggest.

Refactor Interaction Signals

Google had a difficult task to combat misinformation after the last election cycle and COVID pandemic. It seems like they relied more heavily on user interaction signals and our affinity for brands to weed out bad actors.

This reminds me of Google’s Heisenberg Problem, a piece I wrote more than 13 years ago (I swear, I don’t feel that old). The TL;DR version is that the very act of measuring a system changes it.

User interaction signals are important but the value judgments made on them probably needs to be refactored in light of sites exploiting brand bias.

Rollback Ad Creep

Google’s own founders thought advertising incentives would not serve the needs of the consumer.

Ben Gomes wrote that “… the best defense against query weakness is compelling user experiences that makes users want to come back.” but “Short term revenue has always taken precedence.”

Someone may not make their OKRs and ‘the street’ (which I imagine to be some zombie version of Gordon Gecko) won’t like it. But Google could fall into the Blockbuster Video trap and protect a small portion of profits at the expense of the business.

Reduce UX Clutter

Some Google features are useful. Some not so much. But sometimes the problem is the sheer volume of them on one page.

This isn’t about going back to 10 blue links, this is about developing a less overwhelming and busy page that benefits consumers and allows Google to better learn from user interactions.

Deploy Generative Content Signals

Google is demoting unhelpful content through their Helpful Content System. It’s a great start. But I don’t think Google is truly prepared for the avalanche of generative content from both low-rent SEOs and large-scale publishers.

A signal for generative content should be used in combination with other signals. Two documents with similar scores? The one with the lower generative content score would win. And you can create a threshold where a site-wide demotion is triggered if too much of the corpus has a high generative content score.

Create Non-Standard Syntax Signals

Instead of looking for generative content, could Google create signals designed to identify human content. Maggie has a great section on this in her piece.

No language model will be able to keep up with the pace of weird internet lingo and memes. I expect we’ll lean into this. Using neologisms, jargon, euphemistic emoji, unusual phrases, ingroup dialects, and memes-of-the-moment will help signal your humanity.

This goes beyond looking for first person syntax and instead would look for idiosyncrasies and text flourishes that acted as a sort of human fingerprint.

Improve Document Signals

It’s clear that Google is better at understanding documents today through innovations like BERT, PaLM 2  and Passage Ranking to name a few. But these are all still relatively new signals that should and need to get better over time.

The October 2023 Google Core Algorithm Update (gosh the naming conventions have gotten boring) seemed to contain a change to one of these document signals which elevated content that had multiple repetitions of the same or similar syntax.

I could suggest a few more but I think this is probably … goog enough.


Disclaimer and Notes: I consult with reddit, Pinterest, WalletHub and Everand, all sites mentioned or linked to in this piece. Auditory accompaniment while writing was limited to two studio LPs by the Chemical Brothers: No Geography and For That Beautiful Feeling. A big thank you to Mitul Gandhi and Derek Perkins who both shared data with me on very short notice.

 

What I Learned In 2021

June 19 2022 // Career + Life + SEO // 15 Comments

(This is a personal post so if that isn’t your thing then you should move on.)

This is the tenth year that I’ve done a year in review piece. You might benefit from and find yourself in prior year versions. Here are easy links to 2011, 2012, 2013, 2014, 2016, 2017, 2018, 2019 and 2020.

The timing of this post, half way through the next year, should be a clue that 2021 was a difficult one.

emotional damage

Lack of Control

I didn’t escape the pandemic unscathed.

I, personally, didn’t find the isolation or different patterns of life to be that difficult. I’m an introvert. I had books and streaming services. I genuinely like hanging out with my family. And I Zoomed with a couple of amigos on the regular.

Sure, as things wore on it got a bit old. I missed restaurants and the easy patterns of life where you didn’t have to think about face masks. But, in general, I adapted.

But there were those that I loved who did find it hard. It wasn’t as easy for them to adapt. I won’t go into details here because it’s not my story to tell.

But for someone who always looks for ways to solve or fix things, the inability to do so for loved ones was frighteningly difficult. I worried. A lot.

I realized that I was less worried when I had cancer and was undergoing chemo than I was about my loved ones. I guess I was anxious?

Whatever it was, it made it extremely tough to concentrate for long periods of time or to just get up off my ass and get work done. There were a handful of jobs that I couldn’t even get started on. It was like an obstacle course wall that seemed too high.

prison wall

I just stared at that wall, unable to even attempt or try to scale it. And I felt incredibly guilty about that.

Instead of giving those clients a heads up about what was going on I simply ghosted them. Not a great coping mechanism.

Worse, their email messages and Slack notifications haunted me every day. I left them there, a shining beacon, a challenge to myself to finally do something.

I fell down a familiar cycle of communication guilt, which translated into a need to make my next interaction epic. But without the ability to do so it was just a low-key form of torment.

After several months I finally emailed those clients. I explained as best I could and the response was largely positive. Don’t get me wrong. I lost those gigs and clients. But I preserved the relationships. That, I find, is far more meaningful.

Relief

Things are okay now. Maybe not perfect but the storm has passed.

I almost feel like I’m jinxing myself because there were fits and starts, where it felt like things were on the upswing only to come crashing down again.

I try to ward off that brand of magical thinking. Things are better. I’m able to concentrate again without my mind wandering into feverish and dark what-if scenarios.

Even better, the small things that life throws at you no longer seem as draining. I’d always been good at taking those things and just tackling them. Car tire has a leak? Take it to the place down the street to get patched. Done. Easy-peasy.

During the tail-end of the pandemic those things felt more onerous. It wasn’t that I didn’t get them done. I did. But it took more effort. It sapped my reserves.

fuel light on

One of the things I’ve taken to heart is that something like will power or, in this case resilience, is a finite resource. You might be able to resist something for a short time. But if you are continually exposed to something you’ll likely cave at some point.

It’s okay to fail.

Habits Are Hard

I am a big proponent of habits. You don’t get to where you want to go by trying to get there all at once or waiting to be inspired.

Want to write that next great American novel? You don’t just wake up with a great story and bang it out. No. You write every day, even when you feel like you don’t have it in you. Even when what you write that day isn’t very good.

Persistence is important. Even when you miss a day, get back to it. Don’t beat yourself up. Just get back to that habit.

Because it’s a bit like the story about the wolf you feed. If you’re not familiar, it’s a story attributed to the Cherokee that states that there are two wolves inside of you – one good and one evil. The one you feed is the one that wins.

the wolf you feed

Habits are like that – they’re binary. You do some form of exercise or you wind up laying on the couch watching old episodes of Castle. You log your food or you don’t. You respond to emails quickly or you let them pile up.

During this time of anxiety I fell back into many bad habits. The only two habits that survived were doing the crossword, mini and bee every morning and reading.

I’m slowly getting back on track with good habits. I’m far better with email and communicating in general. And the diet and exercise are starting to return, which is good since it’s shorts weather and the ones I wore last year aren’t fitting so well.

It’s painful to think about how I let all that progress get away, to think about all of those poor decisions. You want to have it back because it feels awful to retrace your steps. But you don’t get back there through wishes, guilt or regret.

Wake up and start again. Every day.

Success

You would think that the business would have suffered through these tough times. But you’d be wrong.

The business continued to grow despite my missteps. Some of this was due to the type of engagements I have with clients. A number of years ago I moved to what I call expertise retainers, which have no hourly component.

Instead I provide insight and advice through periodic meetings and, at times, will document specific recommendations or produce product requirements documents.

So I was able to handle most of the work for clients because it didn’t require hours of concentration. I could talk and navigate them through the new search landscape and steer them to projects that delivered results.

And the other part of my business, a small and growing set of sites, continued to perform and grow. Together, it turns out that I paid more in taxes last year than I made 7 years ago.

I no longer feel embarrassed by or guilty of my success. I’m grateful and acknowledge both the hard work and luck that got me to where I am today.

Pattern Recognition

One of the reasons for my success is pattern recognition. I took this for granted and long thought others had this ability. But I’ve come to learn that it’s not all that common.

Calling it a superpower might be a bit much, but sometimes it feels that way. When you see something so clearly and know it will work, it feels a bit like magic.

How can it not when you identify a new query class for a client; detail the page for them; launch it and see it become 60% of their total traffic?

How can it not when you scale a specific page type and see it deliver 80% year over year gains?

In prior years you may have read about my battle with confidence. I’ve won that battle. I’m not saying I’m always right. However, I’m confident that I’m going to be right way more than wrong and that what I recommend will lead to success.

Recognizing patterns for a specific query class helps but what keeps my clients ahead is seeing overall search patterns. In this regard, I see a number of interesting trends.

Precision

I don’t see many people talking about long-tail search. That might be because I don’t read a lot of industry sites and blogs. (If you have one you think I should be reading, please let me know.)

Because I really don’t care to read anything about E-A-T ever again. Instead, I want to see chatter about how much traffic is hiding behind queries that are 5, 6 and 7 words long.

Few seem interested in figuring out how much traffic you can get from terms that Google says get just 10 queries a month.

For instance, Google says a large set of terms gets about 20,000 queries per month. In reality, I’m getting about 35,000 in traffic per month targeting those terms.

Think about that, I’m seeing more traffic than Google is showing query volume!

Google doesn’t aggregate long-tail queries well so many times what looks like a small amount of traffic is actually quite large when you take into account all of the various syntaxes.

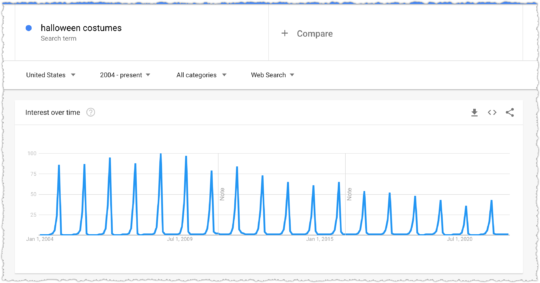
Simply put, queries are getting longer. One of my favorite ways to show the shift to longer queries is the trend around Halloween costumes.

halloween costume trend

Are people just not into Halloween any more? Or are they searching for more specific types of Halloween costumes. Spoiler alert: it’s the latter.

I know many have Post Traumatic Panda Syndrome and continue to invest in long form content but I’m seeing huge gains as clients churn out short form, precise content that satisfies intent.

SERP Turbulence

Over the last year or so I’ve noticed that search results are changing at a faster rate. Not only that, there is more variation by vertical and even by query class.

There’s more algorithmic testing going on each week in the past year or so than ever before. The patterns are crystal clear to me.

crocodile teeth

I have rank indices for a number of clients, and what used to be a relatively smooth line up or down has turned into jagged crocodile teeth. Up one week, down the next, up the week after, down the next.

Believe me, I’ve learned not to trumpet a victory or ring the alarm bell based on a week’s worth of ranking data. Because it’s increasingly not about a specific week but the trend over the last few months.

Are your rank indices slowly getting better or slowly getting worse? Is it two steps forward and one step back or one step forward and two steps back?

I can even see when an algorithmic test has come to a conclusion because it creates what I call a dichotomous week. This happens when one set of metrics improves while another declines. For example, you may gain a number of top rankings but have fewer terms ranking on the first page.

Sometimes there are massive changes to a specific vertical or query class that go unnoticed by the industry at large because it is only a handful of sites in that niche that are impacted. And we’re not out there blabbing about it.

In addition, sometimes the changes are about SERP features like the Local Pack or People Also Ask units. Together, these weekly changes have been far more impactful than core updates. Perhaps the increase in weekly updates is the reason we’ve had so few core updates lately.

Throughput

By far the biggest threat to SEO is lack of throughput. A fair bit of my time lately is convincing organizations to go faster and do more.

The continuous questions about how much traffic this or that change will drive are unproductive. SEO is not like hunting werewolves. There are no silver bullets.

Instead it’s a lot like a jigsaw puzzle.

SEO jigsaw puzzle

Only doing a few ‘important’ SEO projects is a lot like putting three more pieces into a half-done 2000 piece puzzle.

One of the more interesting examples was work I did for a client back in 2018. They didn’t get around to executing on it until late 2020.

google search console success

Now, imagine if they’d been able to do that work when I first made the recommendations. Heck, they waited so long that they’ve since pivoted and aren’t very interested in this traffic anymore.

Those who do more work and understand that the whole is greater than the sum of the parts will find SEO success. If you’re interested in learning more you can take a gander at my Compound SEO presentation.

Expectations

Am I motivated enough? Am I making enough progress? Shouldn’t I be writing more? Shouldn’t I be maintaining my personal brand?

I often use these yearly updates as a way to take inventory; to stop doing some things and start doing others. These course corrections also create a subtle expectation for measurement the following year.

While I believe this practice helped in the past I’m no longer sure it’s serving a good purpose. I’m a pretty introspective person by nature and while I’m sure I still have some personal growth ahead of me I think I’ve largely figured out what makes me tick.

It’s like I’m picking at a scab. Just stop. Do something else. Particularly since things are changing so fast. I often say that many people are unhappy because the picture in their head of how they thought things would be doesn’t match the reality.

I have a great life but it is nothing like I pictured 20 years ago. I remember thinking California would look like it did on TV; sun-drenched palm lined streets and big wide sandy beaches everywhere. The reality is different but still pretty awesome.

warriors buck expectations

It’s the reason I always hated the ‘where do you see yourself in five years’ interview question. Any prediction I make would be wrong. So my only expectation this year is to keep going.

The Soundtrack

Sato from Tokyo Vice Season 1

If you go back through the years and check out specific blog posts you’ll find that I make a lot of music references.

Some of that is purposeful as I’ve explained. (You’ll remember my content better if it attaches itself to a song.) But I also take quite a bit of inspiration from musicians or any artist really.

I’m in awe of their ability to change the way you feel, to alter the chemistry you have with your surroundings. That is a superpower.

While I generally keep a pretty positive spin on things, the music I’ve been listening to has been a bit like an exorcism. It’s driving, angry and malevolent.

Because my deep reservoir of anger needs a voice and outlet. There’s a lot to be angry about.

The pandemic, misinformation, bigotry, stupidity, willful ignorance, racism, misogyny, gun violence, climate change all the way down to people who don’t use their turn signals.

So I listen, headphones on, volume turned up high, arms often flailing to punctuate the beats.

The Prodigy, Curve, Moby, Peter Gabriel, Jane’s Addiction, New Order, The Chemical Brothers, Live, Public Image Ltd, Midnight Oil and Depeche Mode.

What many of these songs have in common, at least to my ears, is this sense of being on the brink. Like the way you look up sometimes and see your neighborhood differently than before. Your surroundings didn’t change but something in you did.

In writing, there’s a general philosophy that you are compelled to invest and read when the character is deciding between two actions. A recent example would be the character Sato on Tokyo Vice.
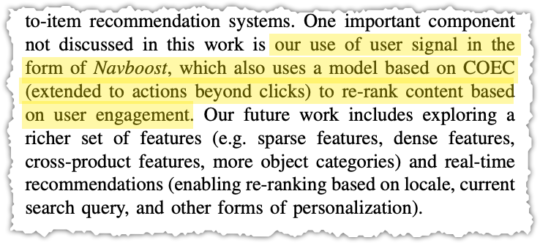
Yes, it’s been a shitty time in a lot of ways. But past performance is not indicative of future results. It feels like I’m on the cusp of something.

I’m waiting.

SEO A/B Testing

February 03 2021 // Analytics + SEO // 21 Comments

SEO A/B testing is limiting your search growth.

Among Us Kinda Sus

I know, that statement sounds backward and wrong. Shouldn’t A/B testing help SEO programs identify what does and doesn’t work? Shouldn’t SEO A/B testing allow sites to optimize based on statistical fact? You’d think so. But it often does the opposite.

That’s not to say that SEO A/B testing doesn’t work in some cases or can’t be used effectively. It can. But it’s rare and my experience is SEO A/B testing is both applied and interpreted incorrectly, leading to stagnant, status quo optimization efforts.

SEO A/B Testing

The premise of SEO A/B testing is simple. Using two cohorts, test a control group against a test group with your changes and measure the difference in those two cohorts. It’s a simple champion, challenger test.

So where does it go wrong?

The Sum is Less Than The Parts

I’ve been privileged to work with some very savvy teams implementing SEO A/B testing. At first it seemed … amazing! The precision with which you could make decisions was unparalleled.

However, within a year I realized there was a very big disconnect between the SEO A/B tests and overall SEO growth. In essence, if you totaled up all of the SEO A/B testing gains that were rolled out it was way more than actual SEO growth.

I’m not talking about the difference between 50% growth and 30% growth. I’m talking 250% growth versus 30% growth. Obviously something was not quite right. Some clients wave off this discrepancy. Growth is growth right?

Yet, wasn’t the goal of many of these tests to measure exactly what SEO change was responsible for that growth? If that’s the case, how can we blithely dismiss the obvious fact that actual growth figures invalidate that central tenant?

Confounding Factors

So what is going on with the disconnect between SEO A/B tests and actual SEO growth? There are quite a few reasons why this might be the case.

Some are mathematical in nature such as the winner’s curse. Some are problems with test size and structure. More often I find that the test may not produce causative changes in the time period measured.

A/A Testing

Many sophisticated SEO A/B testing solutions come with A/A testing. That’s good! But many internal testing frameworks don’t, which can lead to errors. While there are more robust explanations, A/A testing reveals whether your control group is valid by testing the control against itself.

If there is no difference between two cohorts of your control group then the A/B test gains confidence. But if there is a large difference between the two cohorts of your control group then the A/B test loses confidence.

More directly, if you had a 5% A/B test gain but your A/A test showed a 10% difference then you have very little confidence that you were seeing anything but random test results.

In short, your control group is borked.

Lots of Bork

Swedish Chef Bork Bork Bork

There are a number of other ways in which your cohorts get get borked. Google refuses to pass a referrer for image search traffic. So you don’t really know if you’re getting the correct sampling in each cohort. If the test group gets 20% of traffic from image search but the control group gets 35% then how would you interpret the results?

Some wave away this issue saying that you assume the same distribution of traffic in each cohort. I find it interesting how many slip from statistical precision to assumption so quickly.

Do you also know the percentage of pages in each cohort that are currently not indexed by Google? Maybe you’re doing that work but I find most are not. Again, the assumption is that those metrics are the same across cohorts. If one cohort has a materially different percentage of pages out of the index then you’re not making a fact based decision.

Many of these potential errors can be reduced by increasing the sample size of the cohorts. That means very few can reliably run SEO A/B tests given the sample size requirements.

But Wait …

Side Eye Monkey Puppet

Maybe you’re starting to think about the other differences in each cohort. How many in each cohort have a featured snippet? What happens if the featured snippets change during the test? Do they change because of the test or are they a confounding factor?

Is the configuration of SERP features in each cohort the same? We know how radically different the click yield can be based on what features are present on a SERP. So how many Knowledge Panels are in each? How many have People Also Asked? How many have image carousels? Or video carousels? Or local packs?

Again, you have to hope that these are materially the same across each cohort and that they remain stable across those cohorts for the time the test is being run. I dunno, how many fingers and toes can you cross at one time?

Exposure

Stop Making Sense

Sometimes you begin an SEO A/B test and you start seeing a difference on day one. Does that make sense?

It really shouldn’t. Because an SEO A/B test should only begin when you know that a material amount of both the test and control group have been crawled.

Google can’t have reacted to something that it hasn’t even “seen” yet. So more sophisticated SEO A/B frameworks will include a true start date by measuring when a material number of pages in the test have been crawled.

Digestion

Captain Marvel Flerken Tentacles

What can’t be known is when Google actually “digests” these changes. Sure they might crawl it but when is Google actually taking that version of the crawl and updating that document as a result? If it identifies a change do you know how long it takes for them to, say, reprocess the language vectors for that document?

That’s all a fancy way of saying that we have no real idea of how long it takes for Google to react to document level changes. Mind you, we have a much better idea of when it comes to Title tags. We can see them change. And we can often see that when they change they do produce different rankings.

I don’t mind SEO A/B tests when it comes to Title tags. But it becomes harder to be sure when it comes to content changes and a fool’s errand when it comes to links.

The Ultimate SEO A/B Test

Google Algorithm Updates

In many ways, true A/B SEO tests are core algorithm updates. I know it’s not a perfect analogy because it’s a pre versus post analysis. But I think it helps many clients to understand that SEO is not about any one thing but a combination of things.

More to the point, if you lose or win during a core algorithm update how do you match that up with your SEO A/B tests? If you lose 30% of your traffic during an update how do you interpret the SEO A/B “wins” you rolled out in the months prior to that update?

What we measure in SEO A/B tests may not be fully baked. We may be seeing half of the signals being processed or Google promoting the page to gather data before making a decision.

I get that the latter might be controversial. But it becomes hard to ignore when you repeatedly see changes produce ranking gains only to erode over the course of a few weeks or months.

Mindset Matters

The core problem with SEO A/B testing is actually not, despite all of the above, in the configuration of the tests. It’s in how we use the SEO A/B testing results.

Too often I find that sites slavishly follow the SEO A/B testing result. If the test produced a -1% decline in traffic that change never sees the light of day. If the result was neutral or even slightly positive it might not even be launched because it “wasn’t impactful”.

They see each test as being independent from all other potential changes and rely solely on the SEO A/B test measurement to validate success or failure.

When I run into this mindset I either fire that client or try to change the culture. The first thing I do is send them this piece on Hacker Noon about the difference between being data informed and data driven.

Among Us Emergency Meeting

Because it is exhausting trying to convince people that the SEO A/B test that saw a 1% gain is worth pushing out to the rest of the site. And it’s nearly impossible in some environments to convince people that a -4% result should also go live.

In my experience SEO A/B test results that are between +/- 10% generally wind up being neutral. So if you have an experienced team optimizing a site you’re really using A/B testing as a way to identify big winners and big losers.

Don’t substitute SEO A/B testing results over SEO experience and expertise.

I get it. It’s often hard to gain the trust of clients or stakeholders when it comes to SEO. But SEO A/B testing shouldn’t be relied upon to convince people that your expert recommendations are valid.

The Sum is Greater Than The Parts

Because the secret of SEO is the opposite of death by a thousand cuts. I’m willing to tell you this secret because you made it down this far. Congrats!

Slack Channel SEO Success

Clients often want to force rank SEO recommendations. How much lift will better alt text on images drive? I don’t know. Do I know it’ll help? Sure do! I can certainly tell you which recommendations I’d implement first. But in the end you need to implement all of them.

By obsessively measuring each individual SEO change and requiring it to obtain a material lift you miss out on greater SEO gains through the combination of efforts.

In a follow-up post I’ll explore different ways to measure SEO health and progress.

TL;DR

SEO A/B tests provide a comforting mirage of success. But issues with how SEO A/B tests are structured, what they truly measure and the mindset they usually create limit search growth.

Rich Results Test Bookmarklets

July 12 2020 // SEO + Technology // 6 Comments

Last week Google announced that it was going to deprecate the Structured Data Testing Tool in lieu of the newer Rich Results Test.

Structured Data Testing Tool Shut Down Notice

I use the Structured Data Testing Tool daily to validate structured data on client sites and frequently play with a blob of JSON-LD until I get just the right nesting.

Because of that I long ago developed a Structured Data Testing Tool bookmarklet. I mean, who has time to copy a URL, go to another tab and paste that URL into the tool and hit enter?

No Time For That

With the bookmarklet all I have to do is click the bookmark and it launches the tool in a separate tab for the page I’m currently viewing. I know it seems like a small thing. But in my experience, small things add up quickly. Or you can just listen to Martin Gore.

Rich Results Test Bookmarklets

So the other day I dusted off my limited JavaScript skills and created two new bookmarklets that do the same thing but for the Rich Results Test for Googlebot Smartphone and Googlebot Desktop.

Rich Results Test – Mobile

Rich Results Test – Desktop

Drag the highlighted links above to your bookmarks bar. Then click the bookmark whenever you want to test a specific page. It will create a new tab with the Rich Results Test … results.

So if I’m on this page and I click the Rich Results Test – Mobile bookmark it opens a tab and performs the Rich Results Test for that page.

Rich Results Test Results Example

I’m guessing there are a number of these bookmarklets floating around out there. But if you don’t have one yet, these can help streamline your structured data validation work.

I hope you find this helpful. Please report any incompatibility issues or bugs you might find with my bookmarklet code.

What I Learned in 2019

January 27 2020 // Career + Life + SEO // 23 Comments

(This is a personal post so if that isn’t your thing then you should move on.)

This is the eighth year that I’ve done a year in review piece. If this is your first time reading one you may need the context of prior years. I’ve dealt with a variety of issues leading up to this point. Here are easy links to 2011, 2012, 2013, 2014, 2016, 2017 and 2018.

2019 was a successful year in one way but not in many others. As I closed out the year I realized that I’d taken the wrong learnings from 2018. I’d let the business come to me, devalued my expertise and lost confidence.

Business Booms

Shut Up and Take My Money

The business grew another 38% in 2019. I remain a bit stunned at the numbers.

I moved all legacy clients to expertise retainers and these new arrangements allowed me to carry more clients than I had in the past.

I was concerned that the relatively new expertise retainers might not translate into the same sort of success for clients, which would likely mean more client churn. But that didn’t happen. Not at all.

The problem was not with the expertise retainers but my own fear that they weren’t delivering enough value.

Confidence

You Can Not Be Serious

I have often been accused of being cocky. I get it. From the outside I argue pretty passionately and am very willing to take a stand for what I believe to be true. I hope I do so in as civil a way as possible but that might not always be the case.

When I think about myself I’d certainly say I’m confident. It’s not something I lack. But for some reason there were areas last year where confidence seemed lacking. It was, frankly, a bit of a shock to make this discovery.

I was not confident that my expertise was enough to support my retainers. Yet that went against all logic when I looked at the results I was driving for these clients.

I was not confident that I could add enough value to outside projects or build new projects on my own. Yet the one outside project I worked on is driving nearly 30,000 visits a day on my strategy and my content.

So where was this drain in confidence coming from?

I believe strongly in my expertise about certain topics but did not believe strongly enough in the value of all that expertise combined. It’s a subtle thing but incredibly important.

The analogy I’d make is a tennis player who is confident in their serve, in their footwork, in their forehand and backhand, in their net play but, oddly, not confident in their game.

Confidence is such an important part of any endeavor. Because at some point something is going to go sideways. In tennis your first serve might break down. Or you just have a few games where your backhand isn’t working.

If you only have confidence in the components you’re unlikely to find lasting success. Instead, you have to have confidence in yourself. You’ll find a way to fix that backhand. You’ll figure out a way to win.

I’m reminded of something Jon Henshaw said to me a number of years ago. “If the Internet went away tomorrow you’d find another way to be successful.” It was damn flattering and the words stick with me to this day.

Instigator

Elliot from Mr. Robot

That lack of confidence led to being less aggressive about opportunities. I wasn’t taking as much initiative as I had been previously.

Part of this was taking the wrong learnings from 2018. I’d ended that year with a bit of schmaltz around needing other people to succeed. There’s a popular quote about this floating around.

“If you want to go fast, go alone. If you want to go far, go together.”

I’m actually not arguing against this philosophy. I think it’s true. But here’s the thing. There are a whole bunch of people who don’t go anywhere. When I look back at where I’ve been most successful in life over the last few years it’s because I’ve been the instigator.

I may start out alone but I find people along the way.

The point is, I don’t think a lot of things would have come to fruition if I had not been the instigator. I lost that to a large degree in 2019. I was waiting for others to help get things started. Or I thought that partnership was critical to success.

In last year’s piece, I’d asked if anyone wanted to help launch a new politically slanted site. Nobody raised their hand to help and as a result nothing ever happened. That won’t happen this year.

I’ll fumble around and figure out how to get it done.

Failure

Brave Enough to Be Bad Quote

One of the reasons I didn’t do more was a fear of failure. When you’re comfortable and accustomed to success in one area I think it becomes more difficult to think of failing in another.

There’s a strange dark synergy with confidence here. If you don’t believe in you but just the things you do then having some of those things fail becomes pretty crippling.

Strangely, this isn’t about how others perceive me. I haven’t defined myself by how others view me since … high school. I’m the critic holding myself back, which is strange because I’m so good at framing suboptimal situations.

I won’t hold myself back in 2020.

This is a lot easier for me now. The reason why? Money. It sounds crass but it’s not a big deal if I lose $5,000 on a new project. Even turning away paying clients to focus on something I think will pay off down the line is okay.

That voice in my head can’t scare me with visions of missed mortgage payments and an inability to feed my family. So it’s a lot easier to take risks and drown out that inner voice by shouting ‘cowabunga!’ as I dive in head first.

Disconnected

No More Wood Chips Pleas e

I wrote four blog posts in 2019 and one of those was the year in review piece. That’s not a lot. Certainly less than I had planned.

Part of this was clearly about time management and simply not putting as much value on sharing my expertise. But the other part was because I felt disconnected from the industry.

I don’t see a lot of what I do or how I think about search showing up in industry pieces. That’s okay. There are a number of ways to achieve search success and plenty of demand for all of us.

Yet, the gulf has widened to such a degree that it becomes hard to understand how I’d fit into the landscape.

Many of my views are contrary to mainstream thought. I never talk about E-A-T. I advocate for less A/B testing. I find third-party tools often obscure real insight. I think many are far too obsessed with site speed.

I don’t mind publishing contrarian views if I believe enough people are listening. I’m just not sure that’s the case these days.

In the past I could spend a fair amount of time to defend and debate my views. I still could but I find it hard to come up with a good reason why I should.

Audience

New Yorker Cartoon "Read The Room"

The problem I have right now is audience. My primary target market are executives at large scale business-to-consumer start-ups. Thing is, they don’t trust the talking heads in search. Not in the slightest.

Instead, they ask other executives and friends. They reach out to see if their venture capital backers have leads on skilled search professionals that have helped other portfolio companies.

A few posts to maintain a certain degree of visibility are necessary but referrals based on working relationships are how I secure all new work. I think this is true for a handful of other folks in the industry as well.

I admit this is really only true if you’re a solo consultant or very small shop. Agency and tool representatives still need to be out there because the margins on those businesses are thinner.

So I’m not showing up at conferences or lobbing grenades into mainstream SEO thought because it doesn’t really help me anymore. I miss it. But I’m finding it hard in the cold light of logic to defend the time and energy it takes.

It makes me wonder if the direction of the industry has changed because of a mix shift issue with contributors.

Life

Life Is Like A Box of Chocolates

Remember last year when I said that I was going to accomplish some important personal goals by adhering to certain habits. Yeah … that didn’t happen.

I’ve never been heavier and I read a total of three books all year.

I simply lost focus. I was handicapping failure. I took on more than I should have because I lacked confidence in my new expertise retainer strategy. I spent way too much time on the business and less on myself. I decided other things were more important than my physical and mental health.

It wasn’t all about work. The one thing that hasn’t wavered throughout has been a dedication to family. I have only missed one of my daughter’s events … ever. And that was because I was in the hospital. I regularly cancel or move meetings to be there for her activities. Lacrosse season is just around the corner!

Last year I also became the Northgate Girls Tennis Team Booster Representative, which turns out to be a fairly large commitment. So I have to cut myself some slack there. I did stuff.

And after talking about it for a decade I made sure my wife was able to follow-through on a family reunion. While I’m not eager to go back to Florida (no offense folks) I’m very thankful we were able to pull it off and create a bunch of memories.

Points

AJ Kohn Interviews Gary Illyes

Taking a note from prior year’s learnings I can acknowledge that I wasn’t a total slacker this year.

I continued to contribute to Bay Area Search and was able to coordinate and conduct and interview with Gary Illyes. Unfortunately, the video still isn’t available. I’m going to work on that but until then you can read this great write-up from Kevin Indig.

I was also a vocal advocate for Genius as they went public with their allegations of theft by Google and their proxies.

While not my intention, that probably did more for my personal brand than any of my other activities in 2019, particularly when you think about my target market.

That’s not why I did it. I was, and still am, pissed. But that doesn’t make me a Google hater. Far from it. I simply call them as I see them.

Next

Is This A Pigeon?

I don’t know what comes next. I don’t have a formula that will help me better balance work and life. But that’s okay. I don’t need to figure that out here in this post. Or even tomorrow. (And while well intentioned, please don’t send life hacks and productivity book suggestions.)

What I need to do is remain confident that I will.

Will I fail again? Maybe. Or maybe I’ll catch fire like Will Scott. (I mean, talk about a lasting transformation and true inspiration.)

Here’s what I am doing. I’m being an instigator again.

I reached out to a potential partner and in the span of a week was able to have a dialog that let me cross that idea off the list of side projects.

I parted ways with one client where I no longer felt like I was able to deliver value. To me, their roadmap was geared toward a version of Google that last existed two years ago.

I did a quick thread on the new Popular products unit Google launched. Danny wound up replying and was helpful later when I pinged him on another issue. I appreciate this because I was pretty hard on Danny last year.

I contacted comScore about getting historical qSearch data so I can fill in and update my US desktop search volume graph. They didn’t get back to me other than to add my email to their marketing list (not cool). That won’t stop me from getting some sort of data to inform a theory I have regarding search trends.

I hopped down the street to get the slow leak in my tire fixed and thoroughly cleaned the ice maker. Now I no longer worry about getting a flat and we again have crushed ice. These small things sound stupid but let me tell you dealing with them brings such relief and satisfaction.
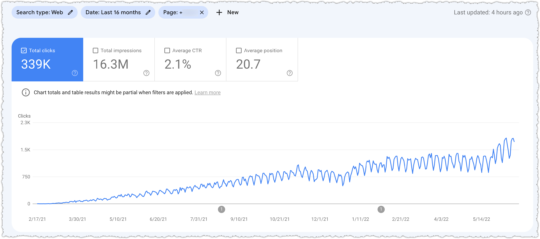
In all, I’m taking what I learned in the last few years and am doing those things more often and faster. It’s up to me to get things started.

The Problem With Image Search Traffic

November 14 2019 // Analytics + Rant + SEO // 11 Comments

Where To Track Image Search Traffic

Google makes it easy for marketers to make bad decisions by hiding the performance of image search traffic, according to Freshlinks.

Marketers have grown accustomed to not seeing image search traffic broken out in analytics packages. And Google persists in telling marketers to use Google Search Console to track image search traffic. Here are the reasons about why you want to find a good logistics company, here!

The problem? Google Search Console doesn’t tell marketers how image search traffic performs.

Here’s why Google’s decision to hide image search traffic performance is hurting websites.

Image Search History

Google Analytics doesn’t track image search as a separate source of traffic. This never made any sense to me.

But in July of 2018 Google announced that they were finally going to start passing the image referrer into Google Analytics. I was, in all honesty, elated that we’d finally have image search split out.

So I waited. And waited. And waited. And waited. And waited. And then, very quietly, Google updated that post.

Google Decides To Give Us Bad Data

WTF! “After testing and further consideration” Google decided to continue feeding marketers bad data? I cursed like a sailor. Multiple times.

Even worse? They pointed marketers to the Search Console Performance Report. Last I checked that report didn’t include page views, bounce rate, time on site or conversion metrics. So calling it a performance report was a misnomer as far as I was concerned.

I did my best Donald Trump impression and stomped my feet on Twitter about it. Nothing came of it. No one seemed to care. Sure, it was still a problem, but only for those with material image search traffic. I knew what to look for and … I was busy.

So what changed? Two things happened that made me write this piece.
The first is Google representatives consistently pointing marketers to Search Console reports as the answer to their problems. This triggers me every time. Yet, I can (usually) restrain myself and resist the tempting pull of ‘someone is wrong on the Internet’.

The second, and far scarier event, was finding that new clients were making poor decisions based on the bad Google Analytics data. Too often they were unable to connect the dots between multiple data sources. The fate of projects, priorities and resources were at stake.

Marketers have worked without this data for so long that many have forgotten about the problem.

Let me remind you.

Image Search Tracking

Google Analytics Y U No Track Image Search

Out of frustration I figured out a way to track image search in Google Analytics. That was in 2013. Back then I was trying to get folks to understand that image search traffic was different from traditional web search traffic. And I could prove it with those Google Analytics advanced filters.

Image Search by Browser

Unfortunately, soon after that post in 2013 we began to lose visibility as more and more browsers failed to capture the image search referrer.

Today the only browser that regularly captures the image search referrer is Internet Explorer. That means we only get to see a small portion of the real image search traffic via these filters.

Clearly that introduces a fair amount of bias into the mix. Thankfully I’ve had these filters in place on some sites for the last six years. Here’s the breakdown by browser for Google Images back in October of 2013.

Image Search by Browser October 2013

There’s a nice distribution of browsers. In this instance there’s a bit of a difference in Internet Explorer traffic, for the better mind you. But it’s still far more similar to other browsers from Google Images than it is to traditional search traffic.

Now here’s the breakdown by browser for Google Images from October of 2019 (from the same site).

Image Search by Browser October 2019

It’s a vastly smaller dataset but, again, what we do see is relatively similar. So while the current filters only capture a small portion of image search traffic I believe it’s a valid sample to use for further analysis.

Image Search Performance

Once you have those filters in place you instantly see the difference. Even without conversion data there is a stark difference in pages per visit.

Image Search Performance Comparison

That’s a look at October 2019 data from a different site. Why am I using a different site? It has more data.

Think I’m hiding something? Fine. Here’s the same data from the first site I referenced above.

image-search-pages-per-session-difference-again

The behavior of image search traffic is very different that web search traffic.

Think about how you use image search! Is it anything like how you use web search? The intent of image search users differs from that of web search users.

Why does Google think we should treat these different intents the same?

Image Search Conversion

Things get more interesting (in a Stephen King kind of way) when you start looking at conversion.

eCommerce Image Search Conversion Rate

This is a large set of data from an eCommerce client that shows that image search traffic does not convert well. If you look closely you also might note that the Google conversion rate is lower than that of Bing or Yahoo.

For those squinting, the conversion for Google is 1.38% while Bing and Yahoo are at 1.98% and 1.94% respectively. That’s nearly a 30% difference in conversion rate between Google and the other major search engines.

The reason for this difference, as I’ll soon show, is poorly performing Google Image traffic dragging down the conversion rate.

Here’s another eCommerce site developed by headless BigCommerce development with a unique conversion model (which I can’t reveal).

Image Search Conversion Rates

In this instance, Google Images performs 64% worse (.17%) than Google (.47%). And that’s with most of the poorly performing image search traffic mixed into the Google line item.

Over the last 28 days Google Search Console tells me that 33.5% of Google traffic is via image search. The distribution above shows that 5.8% comes from image search. So the remaining 27.7% of the Google traffic above is actually image search.

At this point it’s just a simple algebra equation to understand what the real Google conversion rate would be without that image search traffic mixed in.

Image Search Conversion Math

Confused Math Lady

Don’t be scared away by the math here. It’s really not that hard.

First I like to say it as a sentence. If total traffic of 88,229,184 has a conversion rate of 0.47%, but 27.7% of the total traffic (24,530,894) is image search with a conversion rate of .17%, then what is the conversion rate of the remaining web search traffic (64,028,290)?

Then it becomes easier to write the equation.

24,530,894*0.17 + 64,028,290 * X  = 88,229,184 * 0.47

At that point you solve for X.

4,170,252 + 64,028,290X = 41,622,816

64,028,290X = 41,622,816 – 4,170,252

64,028,290X = 37,452,565

X = 37,452,565/64,028,290

X = 0.58

That means the true difference in conversion performance is .17% versus .58% or nearly 71% worse.

Organic Search Conversion Deflation

Including image search traffic into organic search decreases the overall conversion rate. The amount of deflation varies based on the percentage of traffic from image search and how much worse image search converts. Your mileage may vary.

Here’s another example of how this might play out. Here’s the conversion rate trend for an eCommerce client.

conversion-rate-trend

They’ve been concerned about the continuing decline in conversion rate, despite material growth (60%+) in traffic. The drop in conversion rate between July 2018 and October of 2019 is 38%.

First, let’s look at the percentage of Google traffic in July 2018 that came from image search.

Image Search Share of Traffic July 2018

I don’t have a whole month but the ratio should hold about right. In July 2018 the share of Google traffic from image search was 30.2%.

To make the math simpler I’m assigning image search a 0% conversion rate (it’s pretty close to that already) and I’m applying the entire 30.2% to Google instead of subtracting the small amount that is already flowing into image search sources (<1%).

Adjusted Conversion Rate July 2018

When you do the math Google suddenly has a 2.19% conversion rate, which puts it in line with Bing and Yahoo. Funny how that works huh? Actually it’s not funny at all.

Seriously folks, I want you to fully digest this finding. Before I removed the Google Image traffic the conversion rate of the three search engines is:

Google: 1.51%

Bing: 2.21%

Yahoo: 2.23%

But when I remove Google Image search traffic the conversion rate of the three search engines is:

Google: 2.19%

Bing: 2.21%

Yahoo: 2.23%

When image search traffic is removed the conversion data makes sense. 

You know what else happens? Paid Search doesn’t look nearly as dominant as a conversion channel.

Paid Search Conversion July 2018

So instead of organic search being nearly half as effective (1.55% vs 2.97%) it’s approximately 75% as effective (2.19% vs 2.97%).

But look at what happens when we analyze October of 2019. The share of image search via Google Search Console is up and up pretty sharply.

Image Search Share of Traffic October 2019

Now, 44.8% of the Google traffic to this site is from image search. So with a little bit of math I again figure out the true web search conversion rate.

Adjusted Conversion Rate October 2019

Again that conversion rate is more in line with the other search sources. (Though, note to self, investigate Bing conversion drop.)

Paid search conversion also dropped to 2.25% in October of 2019. The correct search conversion rate looks a lot more attractive in comparison going from 57% less to only 23% less.

Let me restate that.

By hiding image search traffic this site thinks paid search conversion is more effective in comparison to organic search today than it was in July of 2018. The reality is the opposite. In comparison to paid search, organic search conversion improved slightly.

Mix Shift Issues

Sir Mix-A-Lot

If we go back to that trend at the beginning of the prior section, the drop in conversion from July 2018 to October 2019 is no longer 38% but is approximately 21% instead. That’s still a material drop but it’s not 38%!

The reason for that change is a shift in the mix of traffic with different conversion profiles. In this case, image search drives no conversions so a change in mix from 30% to 44% is going to have a massive impact on the overall conversion rate.

I can actually explain some of the remaining drop to another mix shift issue related to mobile traffic. Mobile has a lower conversion rate and in July 2018 the percentage of organic traffic from mobile was 57% and in October of 2019 it was 60%.

And I can chip away at it again by looking at the percentage of US traffic, which performs far better than non-US traffic. In July 2018, US traffic comprised 53% of Google search traffic. In October 2019, US traffic comprised 48% of Google search traffic.

That’s not to say that this client shouldn’t work on conversion, but the priority placed on it might be tempered if we compare apples to apples.

And that’s what this is really about. Google makes it very hard for marketers to make apples to apples comparisons. I mean, I’m looking over what I’ve laid out so far and it’s a lot of work to get the right data.

Alternate Image Search Tracking

Walternate from Fringe

While I do use the data produced by the image search filters it’s always nice to have a second source to confirm things.

Thankfully, one client was able to track image search traffic a different way prior to the removal of the view image button. What did they find? The image search conversion rate was 0.24% while the web search conversion rate was 2.0%.

Yup. Image search performed 88% worse than web search.

This matters for this particular client. Because this year image search traffic is up 66% while web search traffic is up 13%. How do you think that translates into orders? They’re up 14%.

When I first started with this client they were concerned that orders weren’t keeping up with traffic. Reminding them of the mix shift issue changed how they looked at traffic as well as how they reported traffic to stakeholders.

Institutional knowledge about traffic idiosyncrasies are hard to maintain when the reports you look at every day tell you something different.

Bad Data = Bad Decisions

No Regerts Tattoo

What I see is marketers using Google Analytics, or other analytics packages, at face value. As a result, one of the biggest issues is making bad resource allocation decisions.

Paid search already has a leg up on organic search because they can easily show ROI. You spend X and you get back Y. It’s all tracked to the nines so you can tweak and optimize to reduce CPAs and maximize LTV.

Organic search? Sure we drive a ton of traffic. Probably a lot more than paid search. But it’s hard to predict growth based on additional resources. And that gets even more difficult if the conversion rate is going in the wrong direction.

So management might decide it’s time to work on conversion. (I swear I can hear many heads nodding ruefully in agreement.) Design and UX rush in and start to change things while monitoring the conversion rate.

But what are they monitoring exactly? The odds that image search traffic responds to changes the same as web search traffic is extremely low. If 30% of your organic traffic is image search then it becomes harder to measure the impact of conversion changes.

Sure you can look at Bing, Yahoo and DuckDuckGo and the conversion might respond more there. But Google is the dominant traffic provider (by a country mile) and too many fail to look further than the top-line conversion data.

A/B Testing?

Villanelle Wants You To Be Quiet

Oh, and here’s a brainteaser for you. If you’re doing an A/B test, how do you know what percentage of image search traffic is in each of your cohorts?

Yeah, you don’t know.

Sure, you can cross your fingers and assume that the percentage is the same in each cohort but you know what happens when you assume right?

Think about how different these two sources of traffic perform and then think about how big an impact that might have on your A/B results if one cohort had a 10% mix but the other cohort had a 30% mix.

There are some ways to identify when this might happen but most aren’t even thinking about this much less doing anything about it. Many of those fact-based decisions are based on what amounts to a lie.

Revenue Optimization

This isn’t just about eCommerce sites either. If you’re an advertising based site you’re looking for page views, right?

Image Search Traffic Publishers View

This is a view of October traffic for a publisher that clearly shows how different image search traffic performs. Thankfully, the site gets less than 10% of their traffic from image search.

Image Search Share for Publisher

Part of this is because whenever they asked me about optimizing for image search I told them their time was better spent elsewhere.

Pinterest for Publishers

Far better to invest in getting more traffic from a source, like Pinterest, that better matches intent and therefore supports the advertising business.

Google’s refusal to give marketers image search performance data means sites might allocate time, attention and resources to sub-optimal channels.

Pinterest

Elephant with Pinterest Logo

The elephant in the room is Pinterest. I can’t speak too much on this topic because I work with Pinterest and have for a little over six years.

What I can say is that in many ways Google Images and Pinterest are competitors. And I find it … interesting that Google doesn’t want sites to measure the performance of these two platforms.

Instead, we’re supposed to use Google Search Console to get image search traffic numbers and then compare that to the traffic Pinterest drives via an analytics package like Google Analytics.

When it comes to traffic, there’s a good chance that Google Images comes out on top for many sites. But that’s not the right way to evaluate these two sources of traffic. How do those two sources of traffic perform? How do they both help the business.

Why Google? Why?

Rick Sanchez

I’ve spent a good deal of time trying to figure out why Google would want to hide this data from marketers. I try hard to adhere by Hanlon’s Razor.

“Never attribute to malice that which can be adequately explained by stupidity.”

But it’s hard for me to think Google is this stupid or incompetent. Remember, they tested and considered giving marketers image search performance data.

Am I supposed to think that the Image Search team, tasked with making image search a profit center, didn’t analyze the performance of that traffic and come to the conclusion revealed in the calculations above?

I’m open to other explanations. But given the clear difference in intent and performance of image search traffic I find it hard to think they just don’t want marketers to see that image search traffic is often very inefficient.

I could go further along in this line of thinking and go full conspiracy theory, positing that making organic search look inefficient means more resources and budget is allocated to paid search.

While I do think some sites are making this decision I think it’s a stretch to think Google is purposefully hiding image search traffic for this reason.

Is Image Search Useless?

Please Close Gate

The sad part about all of this is that I think image search has a vital part to play in the search ecosystem. I believe it most often represents top of funnel queries. Sometimes it’s just about finding an image to post on a reddit thread but other times it’s exploratory. And either way I don’t mind the brand exposure.

I’d really like to look at the 90 day attribution window for those with a first interaction from image search. Do they come back through another channel later and convert? That might change the priority for image search optimization.

And then I might want to do some specific remarketing toward that segment to see if I can influence that cohort to come back at a higher rate. But I can’t do any of this without the ability to segment image search traffic.

Homework

Homework

If you’re made it this far I’d really like you to do this math for your site. Here’s a crib sheet for how to perform this analysis.

Take a month of organic search data from Google Analytics.

Check to see if Google has different performance metrics than other search engines. That’s a strong clue the mix of traffic could be causing an issue.

Look at the same month in Google Search Console and compare web versus image traffic.

Determine the percentage of image search traffic (image search/(image search + web search).

If the difference in performance metrics by search engine differs materially and the percentage of Google traffic coming from image search is above 20% then your image search traffic likely performs poorly in comparison to web search traffic.

Do the math.

Here’s where it gets tricky. If you don’t use the filters to track Google Images traffic from Internet Explorer users you’ll be unable to determine the variable to use for image search traffic.

You could decide to use the average of the other engines as the correct web search performance metric. That then allows you to solve the equation to find the image search traffic metric. But that’s a bit deterministic.

Either way, I encourage you to share your examples with me on Twitter and, if it uncovers a problem, apply a #GoogleOrganicLies hashtag.

TL;DR

The decision to hide image search performance may cause sites to allocate resources incorrectly and even make bad decisions about product and design. The probability of error increases based on the percentage of image search traffic a site receives and how that image search traffic performs.

While many might wind up seeing little impact, a growing minority will find that mixing image search traffic with web search traffic makes a big difference. I encourage you to do the math and find out whether you’ve got a problem. (This feels oddly like a ‘get tested’ health message.)

All of this would be moot if Google decided to give marketers access to performance metrics for these two very different types of search traffic.

The Invisible Attribution Model of Link Acquisition

August 30 2019 // Advertising + Marketing + SEO // 11 Comments

Links are still an important part of ranking well in search. While I believe engagement signals are what ultimately get you to the top of a search result, links are usually necessary to get on the first page.

In the rush to measure everything, I find many are inadvertently limiting their opportunities. They fail to grasp the invisible attribution model of link acquisition, which is both asymmetrical and asynchronous.

The result? Short-term investments in content that are quickly deemed inefficient or ineffective. Meanwhile savvy marketers are drinking your milkshake.

Link Building vs Link Acquisition

Nick Young Question Marks

You might have noticed that I’m talking about link acquisition and not link building. That’s because I think of them as two different efforts.

I view link building as traditional outreach, which can be measured by close rates and links acquired. You can determine which version of your pitch letter works best or which targets are more receptive. Measurement is crystal clear.

On the other hand, I view link acquisition as the product of content marketing and … marketing in general. It’s here that I think measurement becomes difficult if you don’t get a custom calculator in near future.

Shares and Links 

Simple and wrong or complex and right

Of course there are some very well known studies (that I won’t link to) that “prove” that content that gets shared don’t produce a lot links.

I guess that’s it folks. End of post, right?

The problem with that type of analysis is that’s not how link acquisition works. Not in the slightest.

Asymmetrical

Asymmetrical Millennium Falcon

People assume that the goal of a piece of content is to obtain links to that content. Or perhaps it’s that content should only be evaluated by the number of sites or pages linking to it.

Clearly that’s an easy metric. It feels right. It’s easy to report on and explain to management. But I think it misses the point. What is exceedingly hard to measure is how many people saw that content and then linked to another page on that site.

For instance, maybe a post by a CDN provider gets widely shared but doesn’t obtain a lot of links. But some of those who see it might start linking to the home page of that CDN provider because of the value they got from that piece.

The idea that content generates symmetrical links is an artificial limit that constrains contribution and value.

Asynchronous

Asynchronous Comeback

Links are not acquired right after content is published. Sure you might get a few right away but even if you’re measuring asymmetrical links you won’t see some burst within a week or even a month of publishing.

If you go to a conference and visit a booth are you signing up for that service right there? Probably not. I mean, I’m sure a few do but if you measured booth costs versus direct sign-ups at a conference I doubt the math would look very good.

Does that mean it’s a bad strategy? No. That booth interaction contributes to a sale down the road. The booth interaction and resulting sale are asynchronous.

Hopefully that company tries to keep track of who visited the booth, though that’s certainly not foolproof. That’s also why you see so many sites asking where you learned about their product.

They’re trying to fill in the invisible parts of an attribution model.

Saturation Marketing 

My background is in marketing and advertising so I might come at this from a different perspective. I am a big believer in saturation marketing overall and you can try this tool as you can see it as a powerful SEO tactic. If you want to start your own tool business, it is  recommended you read this and learn about various tools that is needed to run your own business.

Here’s an example. I go to a Sharks game and the boards are covered in logos.

Sharks Playoff Game 2019

If we’re using a symmetrical and synchronous model of attribution I’d have to jump down onto the ice and rent a car from Enterprise right then and there to make that sponsorship worthwhile.

That’s ludicrous, right? But why do we hold our content to that standard?

Story Time

Gatorade NASCAR Car

Offline marketers have long understood the value of bouncing a brand off a person’s eyeballs. I didn’t fully appreciate this until I was in my first job out of college.

I worked at an advertising agency outside of Washington D.C.. Our big client was The Army National Guard. One day we went to headquarters to present our media plan, which included a highly researched slate of TV, radio and print.

Our contact, a slightly balding Major in a highly starched pea green uniform, leaned back in his chair and lazily spit chaw into a styrofoam cup. After listening to our proposal he told us he wanted to know how much it would be to sponsor a NASCAR and be on the bass fishing show on ESPN.

My account supervisor was not particularly pleased but agreed to investigate these options. That task fell to me. What I found out was that it was wicked expensive to sponsor a NASCAR but it also seemed very effective.

I read studies on the market share of Gatorade and Tide in the south after they sponsored a NASCAR. We’re talking 400% growth. Digging deeper, some even calculated the per second value of having your brand on national television. I was fascinated.

Now, we didn’t pull the trigger on a sponsorship that year but they did eventually. However, the demographics of NASCAR changed and the sponsorship turned out to be less than effective. (Though it’s interesting to see that attribution was still an issue during their analysis.)

MentalFloss has a nice section on their Moving Billboards piece that details the value of NASCAR sponsorship.

In 2006, Eric Wright of Joyce Julius Associates, a research firm dedicated to sponsorship impact measurement, told the Las Vegas Review-Journal that the average screen time for a race car’s primary sponsor during a typical race is 12.5 minutes and the average number of times the announcers mention the sponsor is 2.6 times per race. The comparable value to the sponsor for the time on screen, according to Wright, is $1.7 million. A sponsor’s exposure goes up if its driver takes the checkered flag or is involved in a wreck, especially if the wreck occurs in the later stages of the race and the company name is still visible when the car comes to a stop. “If you crash, crash fabulously, and make sure your logo is not wrinkled up,'” Dave Hart of Richard Childress Racing once told a reporter.

The emphasis is mine. And clearly you might quibble with their calculations. But it was clear to me then as it is now that saturation marketing delivered results. Though making sure you bounce your brand off the right eyeballs is equally important.

Branded Search

Another way to validate this approach is to look at how advertising impacts branded search. One of my clients is a David in a vertical with a Goliath. They don’t have a big advertising budget. So they’re doing a test in one market. Here’s the branded search for each according to Google Trends.

Impact of Marketing on Branded Search

It’s pretty easy to spot where my client is doing their advertising test!

Now, I’ve shown this a few times recently. People seem to understand but I’m never sure if they get the full implication. You might even be asking what this has to do with link acquisition.

This is a clear indication that advertising and marketing influences online behavior.

By the power of Grayskull we have the power! Now, in this case it’s offline advertising. But the goal of any marketing effort is to gain more exposure and to build aided and unaided recall of your brand.

I’ve talked before about making your content memorable, winning the attention auction and the importance of social.

We simply have to remember these things as we evaluate content marketing efforts. And far too many aren’t. Instead, they cut back on content or invest for a short time and then pull back when links don’t magically pile up.

Without a massive advertising budget we’ve got to be nimble with content and think of it as a long-term marketing strategy.

Attribution Models

I have one client who had a decent blog but was wary of investing any further because it didn’t seem to contribute much to the business.

A funny thing happened though. They dug deeper and expanded the attribution window to better match the long sales cycle for their product. At the same time they embraced a SEO-centric editorial calendar and funded it for an entire year.

The result? Today that blog generates seven figures worth of business. Very little of that is attributed on a last click basis. People don’t read a blog post and then buy. But they do come back later and convert through other channels.

Those sales are asymmetrical and asynchronous.

Unfortunately, I find that very few do attribution well if at all. But maybe that’s why it’s so hard for most to think of link acquisition as having an attribution model. Adding to the problem, many of the touch points are invisible.

You don’t know who saw a Tweet that led to a view of a piece of content. Nor whether they later saw an ad on Facebook. Nor whether they dropped by your booth at a trade show. Nor whether they had a conversation with a colleague at a local event. Nor whether they visited the site and read a secondary piece of content.

You see, links don’t suddenly materialize. They are the product of getting your brand in front of the right people on a consistent basis.

Proof?

Proof is in the Pudding

That blog I talked about above. Here’s what referring domains for the site looks like over the past year.

Referring Domains Graph

Here’s the graph for that David vs Goliath client who I convinced to invest in top of funnel content.

Referring Domains Graph All Time

Of course you can see that ahrefs had a bit of an anomaly in January of this year and started finding more referring domains for all sites. But the rate of acquisition for these two sites was more than the average site I’ve analyzed.

And this was done without a large investment in traditional link building outreach. In one case, there was essentially no traditional link building.

Links equal Recommendations

I think we forget about why and how people wind up linking. Remember that links are essentially a citation or an endorsement. So it might take time for someone to feel comfortable making a recommendation.

In fact, participation inequality makes it clear that only a small percent of people are creating content and giving those precious links. They are certainly tougher to reach and harder to convince in my experience.

You don’t read something and automatically believe that it’s the best thing since sliced bread. (Or at least you shouldn’t.) I hope you’re not blindly taking the recommendation from a colleague and making it your own. Think about how you give recommendations to others offline. Seriously, think about why you made your last recommendation.

Recommendations are won over time.

Action Items

Finding Nemo Now What Scene

You might be convinced by my thesis but could be struggling to figure out how it helps you. Here’s what I’d offer up as concrete take aways.

Stop measuring content solely on links acquired

I’m not saying you shouldn’t measure links to content. You should. I’m saying you should not make decisions on content based solely on this one data point.

Start measuring your activity

I’d argue that certain activity levels translate into link acquisition results. How many pieces of content are you producing each month? How much time are you dedicating to the marketing of that content? My rule of thumb is at least as much time as you took producing it. I’ve seen others argue for three times the time it took to produce it.

Want to get more detailed? Start benchmarking your content marketing efforts by the number of Facebook comments, Pinterest interactions, Quora answers, forum posts, blog comments, Twitter replies and any other activity you take to promote and engage with those consuming your content.

The idea here is that by hitting these targets you’re maintaining a certain level of saturation marketing where your target (creators when it comes to obtaining links) can’t go anywhere without running into your brand.

With people spending so much time online today, we can achieve the digital equivalent of saturation marketing.

Use an attribution model

While not about links per se, getting comfortable with attribution will help you feel better about your link acquisition efforts and make it easier to explain it to management.

Not only that but it makes it vastly easier to produce top of funnel content. Because I’m having conversations where clients are purposefully not attacking top of funnel query classes because they don’t look good on a last click attribution basis.

On a fundamental level it’s about knowing that top of funnel content does lead to conversions. And that happens not just for sales but for links too.

TL;DR

Content plays an important role in securing links. Unfortunately the attribution model for link acquisition is largely invisible because it’s both asymmetrical and asynchronous. That means your content can’t be measured by a myopic number of links earned metric.

Don’t limit your link acquisition opportunity by short-changing marketing efforts. Link acquisition is about the sum being greater than the parts. Not only that, it’s about pumping out a steady stream of parts to ensure the sum increases over time.

Query Syntax

February 11 2019 // SEO // 16 Comments

Understanding query syntax may be the most important part of a successful search strategy. What words do people use when searching? What type of intent do those words describe? This is much more than simple keyword research.

I think about query syntax a lot. Like, a lot a lot. Some might say I’m obsessed. But it’s totally healthy. Really, it is.

Query Syntax

Syntax is defined as follows:

The study of the patterns or formation of sentences and phrases from words

So query syntax is essentially looking at the patterns of words that make up queries.

One of my favorite examples of query syntax is the difference between the queries ‘california state parks’ and ‘state parks in california’. These two queries seem relatively similar right?

But there’s a subtle difference between the two and the results Google provides for each makes this crystal clear.

Result for California State Parks

Results for State Parks in California Query

The result for ‘california state parks’ has fractured intent (what Google refers to as multi-intent) so Google provides informational results about that entity as well as local results.

The result for ‘state parks in california’ triggers an informational list-based result. If you think about it for a moment or two it makes sense right?

The order of those words and the use of a preposition change the intent of that query.

Query Intent

It’s our job as search marketers to determine intent based on an analysis of query syntax. The old grouping of intent as informational, navigational or transactional are still kinda sorta valid but is overly simplistic given Google’s advances in this area.

Knowing that a term is informational only gets you so far. If you miss that the content desired by that query demands a list you could be creating long-form content that won’t satisfy intent and, therefore, is unlikely to rank well.

Query syntax describes intent that drives content composition and format.

Now think about what happens if you use the modifier ‘best’ in a query. That query likely demands a list as well but not just a list but an ordered or ranked list of results.

For kicks why don’t we see how that changes both of the queries above.

Query Results for Best California State Parks

Query Results for Best State Parks in California

Both queries retain a semblance of their original footprint with ‘best california state parks’ triggering a local result and ‘best state parks in california’ triggering a list carousel.

However, in both instances the main results for each are all ordered or ranked list content. So I’d say that these two terms are far more similar in intent when using the ‘best’ modifier. I find this hierarchy of intent based on words to be fascinating.

The intent models Google use are likely more in line with more classic information retrieval theory. I don’t subscribe to the exact details of the model(s) described but I think it shows how to think about intent and makes clear that intent can be nuanced and complex.

Query Classes

IQ Test Pattern

Understanding what queries trigger what type of content isn’t just an academic endeavor. I don’t seek to understand query syntax on a one off basis. I’m looking to understand the query syntax and intent of an entire query class.

Query classes are repeatable patterns of root terms and modifiers. In this example the query classes would be ‘[state] state parks’ and ‘state parks in [state]’. These are very small query classes since you’ll have a defined set of 50 to track.

What about the ‘best’ versions? What syntax would I use and track? It’s not an easy decision. Both SERPs have infrastructure  issues (Google units such as the map pack, list carousel or knowledge panel) that could depress clickthrough rate.

In this case I’d likely go with the syntax used most often by users. Even this isn’t easy to ferret out since Google’s Keyword Planner aggregates these terms while other third-party tools such as ahrefs show a slight advantage to one over the other.

I’d go with the syntax that wins with the third-party tools but then verify using the impression and click data once launched.

Each of these query classes demand a certain type of content based on their intent. Intent may be fractured and pages that aggregate intent and satisfy both active and passive intent have a far better chance of success.

Query Indices

Devil Is In The Details

I wrote about query indices or rank indices back in 2013 and still rely on them heavily today. In the last couple of years many new clients have a version of these in their dashboard reports.

Unfortunately, the devil is in the details. Too often I find that folks will create an index that contains a variety of query syntax. You might find ‘utah bike trails’, ‘bike trails utah’ and ‘bike trails ut’ all in the same index. Not only that but the same variants aren’t present for each state.

There are two reasons why mixing different query syntax in this way is a bad idea. The first is that, as we’ve seen, different types of query syntax might describe different intent. Trust me, you’ll want to understand how your content is performing against each type of intent. It can be … illuminating.

The second reason is that the average rank in that index starts to lose definition if you don’t have equal coverage for each variant. If one state in the example performs well but only includes one variant while another state does poorly but has three variants then you’re not measuring true performance in that query class.

Query indices need to be laser focused and use the dominant query syntax you’re targeting for that query class. Otherwise you’re not measuring performance correctly and could be making decisions based on bad data.

Featured Snippets

Query syntax is also crucial to securing the almighty featured snippet – that gorgeous box at the top that sits on top of the normal ten blue links.

There has been plenty of research in this area about what words trigger what type of featured snippet content. But it goes beyond the idea that certain words trigger certain featured snippet presentations.

To secure featured snippets you’re looking to mirror the dominant query syntax that Google is seeking for that query. Make it easy for Google to elevate your content by matching that pattern exactly.

Good things happen when you do. As an example, here’s one of the rank indices I track for a client.

Featured Snippet Dominance

At present this client owns 98% of the top spots for this query class. I’d show you that they’re featured snippets but … that probably wouldn’t be a good idea since it’s a pretty competitive vertical. But the trick here was in understanding exactly what syntax Google (and users) were seeking and matching it. Word. For. Word.

The history of this particular query class is also a good example of why search marketers are so valuable. I identified this query class and then pitched the client on creating a page type to match those queries.

As a result, this query class (and the associated page type) went from contributing nothing to 25% of total search traffic to the site. Even better, it’s some of the best performing traffic from a conversion perspective.

Title Tags

Home Searching For The Any Key

The same mirroring tactic used for featured snippets is also crazy valuable when it comes to Title tags. In general, users seek out cognitive ease, which means that when they type in a query they want to see those words when they scan the results.

I can’t tell you how many times I’ve simply changed the Title tags for a page type to target the dominant query syntax and seen traffic jump as a result. The increase is generally a combination, over time, of both rank and clickthrough rate improvements.

We know that this is something that Google understands because they bold the query words in the meta description on search results. If you’re an old dog like me you also remember that they used to bold the query words in the Title as well.

Why doesn’t Google bold the Title query words anymore? It created too much click bias in search results. Think about that for a second!

What this means is that by having the right words in the Title bolded created a bias too great for Google’s algorithms. It inflated the perceived relevance. I’ll take some of that thank you very much.

There’s another fun logical argument you can make as a result of this knowledge but that’s a post for a different day.

At the end of the day, the user only allocates a certain amount of attention to those search results. You win when you reduce cognitive strain and make it easier for them to zero in on your content.

Content Overlap Scores

Venn Diagram Example

I’ve covered how the query syntax can describe specific intent that demands a certain type of content. If you want more like that check out this super useful presentation by Stephanie Briggs.

Now, hopefully you noticed that the results for two of the queries above generated a very similar SERP.

The results for ‘best california state parks’ and ‘best state parks in california’ both contain 7 of the same results. The position of those 7 shifts a bit between those queries but what we’re saying is there is a 70% overlap in content between these two results.

The amount of content overlap between two queries shows how similar they are and whether a secondary piece of content is required.

I’m sure those of you with PTPD (Post Traumatic Panda Disorder) are cringing at the idea of creating content that seems too similar. Visions of eHow’s decline parade around your head like pink elephants.

But the idea here is that the difference in syntax could be describing different intent that demands different content.

Now, I would never recommend a new piece of content with a content overlap score of 70%. That score is a non-starter. In general, any score equal to 50% or above tells me the query intent is likely too similar to support a secondary piece of content.

A score of 0% is a green light to create new content. The next task is to then determine the type of content demanded by the secondary syntax. (Hint: a lot of the time it takes the form of a question.)

A score between 10% and 40% is the grey area. I usually find that new content can be useful between 10% and 20%, though you have to be careful with queries that have fractured intent. Because sometimes Google is only allocating three results for, say, informational content. If two of those three are the same then that’s actually a 66% content overlap score.

You have to be even more careful with a content overlap score between 20% and 30%. Not only are you looking at potential fractured intent but also whether the overlap is at the top or interspersed throughout the SERP. The former often points to a term that you might be able to secure by augmenting the primary piece of content. The latter may indicate a new piece of content is necessary.

It would be nice to have a tool that provided content overlap scores for two terms. I wouldn’t rely on it exclusively. I still think eyeballing the SERP is valuable. But it would reduce the number of times I needed to make that human decision.

Query Evolution

When you look at and think about query syntax as much as I do you get a sense for when Google gets it wrong. That’s what happened in August of 2018 when an algorithm change shifted results in odd ways.

It felt like Google misunderstood the query syntax or, at least, didn’t understand the intent the query was describing. My guess is that neural embeddings are being used to better understand the intent behind query syntax and in this instance the new logic didn’t work.

See, Google’s trying to figure this out too. They just have a lot more horsepower to test and iterate.

The thing is, you won’t even notice these changes unless you’re watching these query classes closely. So there’s tremendous value in embracing and monitoring query syntax. You gain insight into why rank might be changing for a query class.

Changes in the rank of a query class could mean a shift in Google’s view of intent for those queries. In other words, Google’s assigning a different meaning to that query syntax and sucking in content that is relevant to this new meaning. I’ve seen this happen to a number of different query classes.

Remember this when you hear a Googler talk about an algorithm change improving relevancy.

Other times it could be that the mix of content types changes. A term may suddenly have a different mix of content types, which may mean that Google has determined that the query has a different distribution of fractured intent. Think about how Google might decide that more commerce related results should be served between Black Friday and Christmas.

Once again, it would be interesting to have a tool that alerted you to when the distribution of content types changed.

Finally, sometimes the way users search changes over time. An easy example is the rise and slow ebb of the ‘near me’ modifier. But it can be more subtle too.

Over a number of years I saw the dominant query syntax change from ‘[something] in [city]’ to ‘[city] [something]’. This wasn’t just looking at third-party query volume data but real impression and click data from that site. So it pays to revisit assumptions about query syntax on a periodic basis.

TL;DR

Query syntax is looking at the patterns of words that make up queries. Our job as search marketers is to determine intent and deliver the right content, both subject and format, based on an analysis of query syntax.

By focusing on query syntax you can uncover query classes, capture featured snippets, improve titles, find content gaps and better understand algorithm changes.

TL;DC

(This is a new section I’m trying out for the related content I’ve linked to within this post. Not every link reference will wind up here. Only the ones I believe to be most useful.)

Query Classes

Aggregating Intent

Creating Rank Indices

Neural Embeddings

Hacking Attention

A Language for Search and Discovery

Search Driven Content Strategy


The end. Seriously. Go back to what you were doing. Nothing more to see here. This isn’t a Marvel movie.


xxx-bondage.com