You Are Browsing The SEO Category

Find Keyword Modifiers with Google Refine

January 15 2011 // SEO // 8 Comments

Google RefineKeyword research is a vital component of SEO. Part of that research usually entails finding the most frequent modifiers for a keyword. There are plenty of ways to do this but here’s a new way to do so using Google Refine.

Google Refine

Google Refine came about through the Metaweb acquisition in July of 2010 and is an evolution of Freebase Gridworks. So what is it exactly?

Google Refine is a power tool for working with messy data, cleaning it up, transforming it from one format into another, extending it with web services, and linking it to databases like Freebase.

I’ve been poking at Freebase for years thanks to Chris Eppstein and think that it was one of Google’s smarter acquisitions of late. But I just returned to Google Refine as I embarked on some keyword research.

Root Keywords

Lets say you have a site that sells boots. Clearly the term ‘boots’ is one of the root (or main) keywords for the site. Finding keyword modifiers can help you match query intent to products and site content. Modifiers can be applied to SEO and PPC campaigns.

There are a number of keyword tools but I’ll use Google in this example.

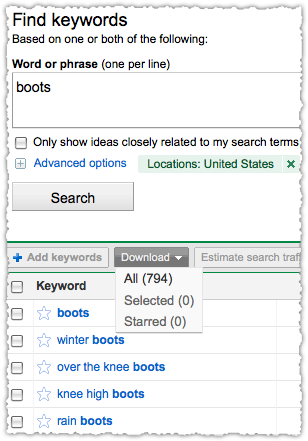
Boots Keyword Suggestions

There are 794 keyword suggestions and many of them overlap with one another. I could wade through them in Excel and apply some sort of filter or toss them into a Pivot Table but Google Refine actually makes this much easier.

Install Google Refine

You’ll need to download and install Google Refine and then point your browser to http://127.0.0.1:3333/ to get started.

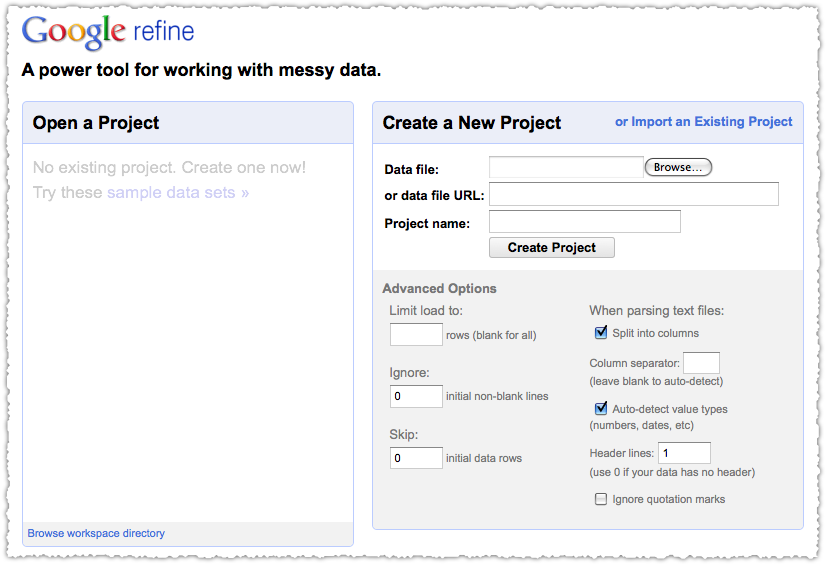
Start a Google Refine Project

Create a Google Refine Project

Browse for and select that downloaded keyword file, type in a Project name and click Create Project.

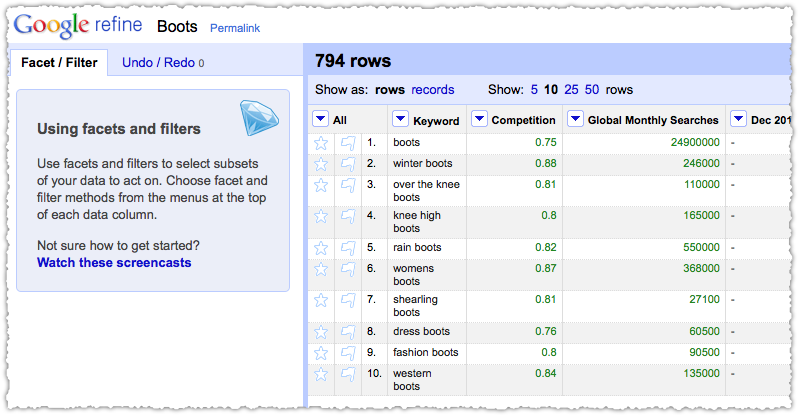
Google Refine Interface

At this point it’s a lot like having a pre-formatted Google Doc. But that’s where the similarities end.

Apply a Word Facet

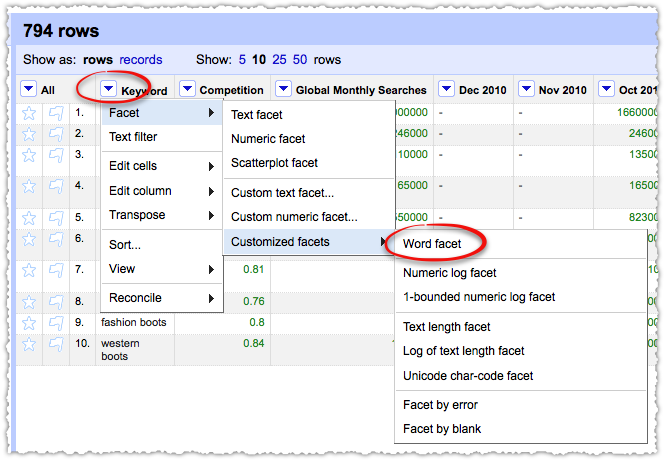
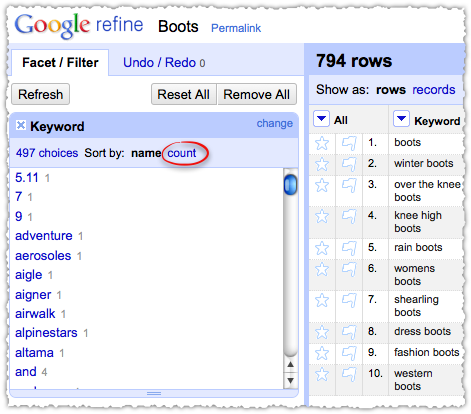
Google Refine comes loaded with a massive amount of intelligence. What I’m going to show you is probably the least sophisticated part of Google Refine. Select the Keyword drop down arrow and navigate to Word Facet. (Facet > Customized facets > Word facet)

Apply a Google Refine Word Facet

You’ll quickly get a new pane on the left hand side showing the result of applying this word facet.

Google Refine Word Facet Result

Sorting a Word Facet

Google Refine is telling me that it’s narrowed those 794 rows into 497 choices and ordered them by name. But instead I want to learn about the most frequent modifiers. No problem. Just sort by count.

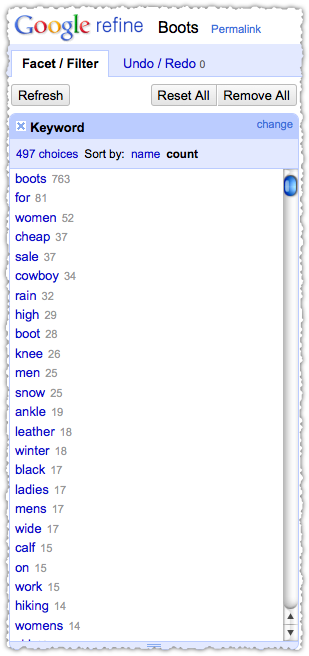
Sort Word Facet by Count

Just like that I get the most frequent modifiers for the term boots. You still need to apply some smarts to understand why ‘for’ might be listed or how ‘high’ might be used as a modifier. But it’s a super quick way to get an at-a-glance perspective.

Word Drill Down

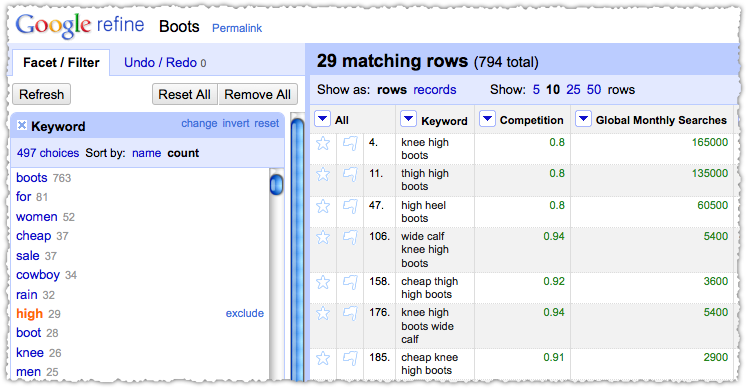
If you’re having trouble figuring out a specific word you can just click on the word to get a sample of those keyword terms.

Google Refine Word Facet Drill Down

Who knew wide calves were such a problem?

Google Refine and Keyword Research

Google Refine doesn’t replace other SEO tools. Instead it’s just another tool on your tool belt. That said, I have only showed you a fraction of what Google Refine is capable of. In particular, there are some very interesting clustering algorithms that could be applied to keyword research.

I’m just getting started and will keep playing with (aka learning) Google Refine to see just how it might streamline keyword research.

Optimize Your Sitemap Index

January 11 2011 // Analytics + SEO // 20 Comments

Information is power. It’s no different in the world of SEO. So here’s an interesting way to get more information on indexation by optimizing your sitemap index file.

What is a Sitemap Index?

A sitemap index file is simply a group of individual sitemaps, using an XML format similar to a regular sitemap file.

You can provide multiple Sitemap files, but each Sitemap file that you provide must have no more than 50,000 URLs and must be no larger than 10MB (10,485,760 bytes). […] If you want to list more than 50,000 URLs, you must create multiple Sitemap files.

If you do provide multiple Sitemaps, you should then list each Sitemap file in a Sitemap index file.

Most sites begin using a sitemap index file out of necessity when they bump up against the 50,000 URL limit for a sitemap. Don’t tune out if you don’t have that many URLs. You can still use a sitemap index to your benefit.

Googling a Sitemap Index

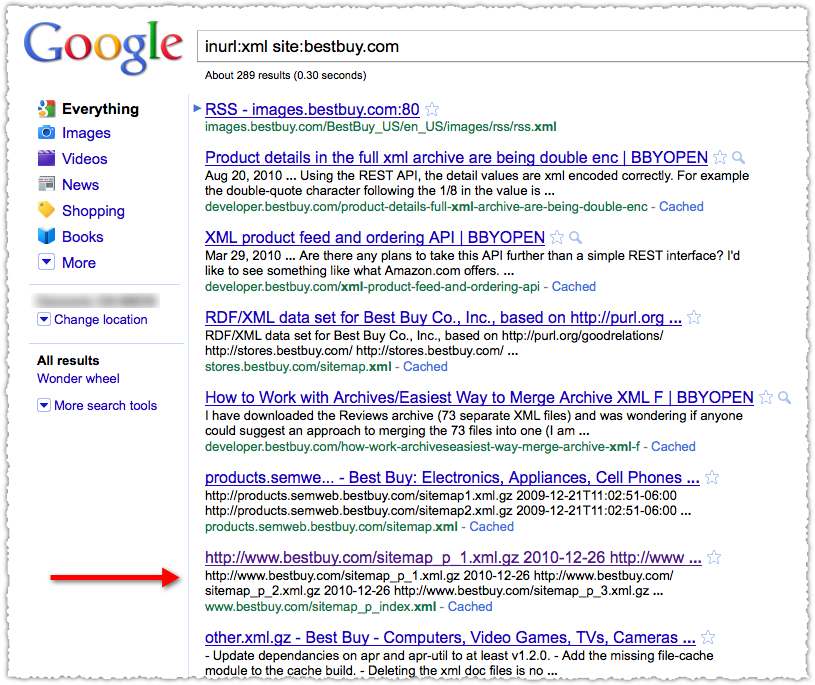
I’m going to search for a sitemap index to use as an example. To do so I’m going to use the inurl: and site: operators in conjunction.

Google a Sitemap Index

Best Buy was top of mind since I recently bought a TV there and I have a Reward Zone credit I need to use. The sitemap index wasn’t difficult to find in this case. However, they don’t have to be named as such. So if you’re doing some competitive research you may need to poke around a bit to find the sitemap index and then validate that it’s the correct one.

Opening a Sitemap Index

You can then click on the result and see the individual sitemaps.

Inspect Sitemap Index

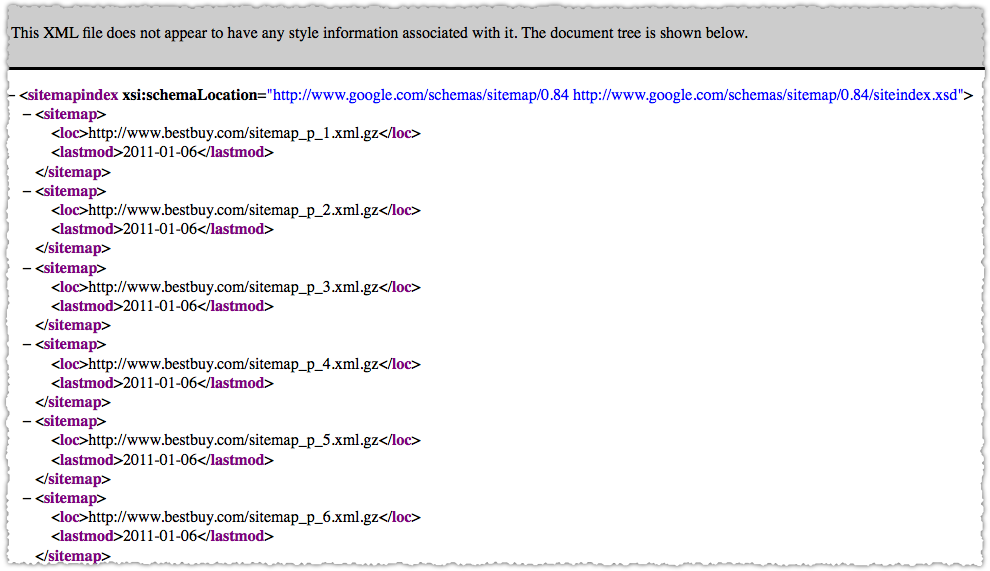
Here’s what the sitemap index looks like. A listing of each individual sitemap. In this case there are 15 of them, all sequentially numbered.

Looking at a Sitemap

The sitemaps are compressed using gzip so you’ll need to extract them to look at an individual sitemap. Copy the URL into your browser bar and the rest should take care of itself. Fire up your favorite text program and you’re looking at the individual URLs that comprise that sitemap.

Best Buy Sitemap Example

So within one of these sitemaps I quickly find that there are URLs that go to a TV a Digital Camera and a Video Game. They are all product pages but there doesn’t seem to be any grouping by category. This is standard, but it’s not what I’d call optimized.

Sitemap Index Metrics

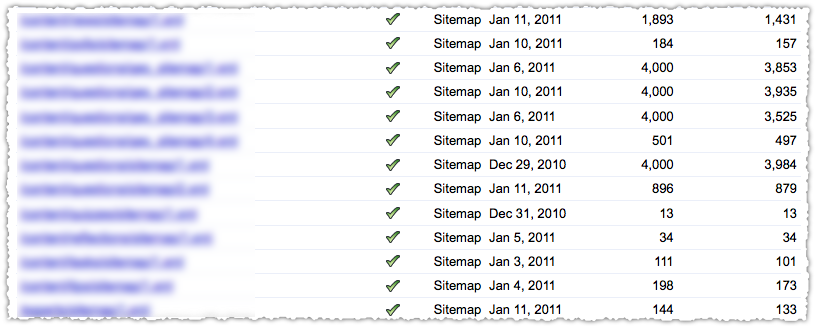
Within Google Webmaster tools you’ll be able to see the number of URLs submitted and the number indexed by sitemap

Here’s an example (not Best Buy) of sitemap index reporting in Google Webmaster tools.

Sitemap Index Metric Sample

So in the case of the Best Buy sitemap index, they’d be able to drill down and know the indexation rate for each of their 15 sitemaps.

What if you created those sitemaps with a goal in mind?

Sitemap Index Optimization

Instead using some sequential process and having products from multiple categories in an individual sitemap, what if you created a sitemap specifically for each product type?

  • sitemap.tv.xml
  • sitemap.digital-cameras.xml
  • sitemap.video-games.xml

In the case of video games you might need multiple sitemaps if the URL count exceeds 50,000. No problem.

  • sitemap.video-games-1.xml
  • sitemap.video-games-2.xml

Now, you’d likely have more than 15 sitemaps at this point but the level of detail you suddenly get on indexation is dramatic. You could instantly find that TVs were indexed at a 95% rate while video games were indexed at a 56% rate. This is information you can use and act on.

It doesn’t have to be one dimensional either, you can pack a lot of information into individual sitemaps. For instance, maybe Best Buy would like to know the indexation rate by product type and page type. By this I mean, would Best Buy want to know the indexation rate of category pages (lists of products) versus product pages (an individual product page.)

To do so would be relatively straight forward. Just split each product type into separate page type sitemaps.

  • sitemap.tv.category.xml
  • sitemap.tv.product.xml
  • sitemap.digital-camera.category.xml
  • sitemap.digital-camera.product.xml

And so on and so forth. Grab the results from Webmaster Tools and drop them into Excel and in no time you’ll be able to slice and dice the indexation rates to answer the following questions. What’s the indexation rate for category pages versus product pages? What’s the indexation rate by product type?

You can get pretty granular if you want though you can only pack each sitemap index with 50,000 sitemaps. Then again, you’re not limited to just one sitemap index either!

In addition, you don’t need 50,000 URLs to use a sitemap index. Each sitemap could contain a small amount of URLs, so don’t pass on this type of optimization thinking it’s just for big sites.

Connecting the Dots

Knowing the indexation rate for each ‘type’ of content gives you an interesting view into what Google thinks of specific pages and content. The two other pieces of the puzzle are what happens before (crawl) and after (traffic). Both of these can be solved.

Crawl tracking can done by mining weblogs for Googlebot (and Bingbot) by the same sitemap criteria. So, not only do I know how much bots are crawling each day I know where they’re crawling. As you make SEO changes, you are then able to see how it impacts the crawl and follow it through to indexation.

The last step is mapping it to traffic. This can be done by creating Google Analytics Advanced Segments that match the sitemaps using regular expressions. (RegEx is your friend.) With that in place, you can track changes in the crawl to changes in indexation to changes in traffic. Nirvana!

Go to the Moon

Doing this is often not an easy exercise and may, in fact, require a hard look at site architecture and URL naming conventions. That might not be a bad thing in some cases. And I have implemented this enough times to see the tremendous value it can bring to an organization.

I know I covered a lot of ground so please let me know if you have any questions.

Google is not a Field of Dreams

January 02 2011 // Rant + SEO // 1 Comment

There is a rising tide of advice lately extolling the virtues of creating a valuable site focused on the user and that the rest … will simply come.

If you build it they will come

If you think this happens online (or anywhere outside of the movies), you’ll be waiting a long time for Ray Liotta to saunter out of that digital cornfield. And you won’t have traffic beating a path to your door like the closing shot of Field of Dreams.

Field of Dreams SEO

The story sounds great, doesn’t it? Write scintillating content and you’ll get search traffic. Build a useful, interesting site and the Google gods will smile upon you. Maybe this is how it works in some magical Utopian world where it rains marshmallows.

Field of Dreams

It would be great if the sites that were most useful were always ranked appropriately. But spend any time doing SEO (the kind where you’re in the trenches) and you know this is patently not true, nor (sadly) does it seem to be getting much better.

That’s not to say that you shouldn’t build a great site focused on users that delivers tremendous value. That just isn’t enough. You still need SEO to ensure the great site you’ve built gets in front of the right people.

Trash and Treasure

Here’s the hard truth, you may not be appealing to as many people as you think. Your definition of value might not be the definition others use, particularly not the definition Google uses. This is why I find the pollyanna around Field of Dreams SEO to be so dangerous. Because there is a nugget of truth to the notion.

Writing great content and building a valuable site is a critical part of SEO. But this means different things to different people. Put another way, one person’s trash is another person’s treasure and vice versa. As an example, I may find William Faulkner unreadable, but others may adore his novels.

Waterworld

SEO winds up being director, editor and agent – helping to shape your content and site so it is appealing to the major studios. Sure, maybe you can go the ‘Indie’ route, bucking the establishment and releasing it in small art house movie theaters. But how many times does that really work?

don't ignore seo

Ignore SEO and you’ll wind up with Waterworld instead of Field of Dreams.

2011 Predictions

December 31 2010 // Analytics + Marketing + SEO + Social Media + Technology + Web Design // 3 Comments

Okay, I actually don’t have any precognitive ability but I might as well have some fun while predicting events in 2011. Lets look into the crystal ball.

2011 Search Internet Technology Predictions

Facebook becomes a search engine

The Open Graph is just another type of index. Instead of crawling the web like Google, Facebook lets users do it for them. Facebook is creating a massive graph of data and at some point they’ll go all Klingon on Google and uncloak with several bird of prey surrounding search. Game on.

Google buys Foursquare

Unless you’ve been under a rock for the last 6 months it’s clear that Google wants to own local. They’re dedicating a ton of resources to Places and decided that getting citations from others was nice but generating your own reviews would be better. With location based services just catching on with the mainstream, Google will overpay for Foursquare and bring check-ins to the masses.

UX becomes more experiential

Technology (CSS3, Compass, HTML5, jQuery, Flash, AJAX and various noSQL databases to name a few) transforms how users experience the web. Sites that allow users to seamlessly understand applications through interactions will be enormously successful.

Google introduces more SEO tools

Google Webmaster Tools continues to launch tools that will help people understand their search engine optimization efforts. Just like they did with Analytics, Google will work hard in 2011 to commoditize SEO tools.

Identity becomes important

As the traditional link graph becomes increasingly obsolete, Google seeks to leverage social mentions and links. But to do so (in any major way) without opening a whole new front of spam, they’ll work on defining reputation. This will inevitably lead them to identity and the possible acquisition of Rapleaf.

Internet congestion increases

Internet congestion will increase as more and more data is pushed through the pipe. Apps and browser add-ons that attempt to determine the current congestion will become popular and the Internati will embrace this as their version of Greening the web. (Look for a Robert Scoble PSA soon.)

Micropayments battle paywalls

As the appetite for news and digital content continues to swell, a start-up will pitch publications on a micropayment solution (pay per pageview perhaps) as an alternative to subscription paywalls. The start-up may be new or may be one with a large installed user base that hasn’t solved revenue. Or maybe someone like Tynt? I’m crossing my fingers that it’s whoever winds up with Delicious.

Gaming jumps the shark

This is probably more of a hope than a real prediction. I’d love to see people dedicate more time to something (anything!) other than the ‘push-button-receive-pellet’ games. I’m hopeful that people do finally burn out, that the part of the cortex that responds to this type of gratification finally becomes inured to this activity.

Curation is king

The old saw is content is king. But in 2011 curation will be king. Whether it’s something like Fever, my6sense or Blekko, the idea of transforming noise into signal (via algorithm and/or human editing) will be in high demand, as will different ways to present that signal such as Flipboard and Paper.li.

Retargeting wins

What people do will outweigh what people say as retargeting is both more effective for advertisers and more relevant for consumers. Privacy advocates will howl and ally themselves with the government. This action will backfire as the idea of government oversight is more distasteful than that of corporations.

Github becomes self aware

Seriously, have you looked at what is going on at Github? There’s a lot of amazing work being done. So much so that Github will assemble itself Voltron style and become a benevolently self-aware organism that will be our digital sentry protecting us from Skynet.

Google Split Testing Tool

December 23 2010 // Analytics + SEO // Comments Off on Google Split Testing Tool

In November Matt Cutts asked ‘What would you do if you were CEO of Google?‘ He was essentially asking readers for a wish list of big ideas. I submitted a few but actually forgot what would be at the top of my list.

Google Christmas

Google A/B Testing

Google does bucket testing all the time. Bucket testing is just another (funnier) word for split testing or A/B testing.

A/B testing, split testing or bucket testing is a method of marketing testing by which a baseline control sample is compared to a variety of single-variable test samples in order to improve response rates. A classic direct mail tactic, this method has been recently adopted within the interactive space to test tactics such as banner ads, emails and landing pages.

Google provides this functionality through paid search via AdWords. Any reputable PPC marketer knows that copy testing is critical to the success of a paid search campaign.

SERP Split Testing Tool

Why not have split testing for SEO? I want to be able to test different versions of my Title and Meta Description for natural search. Does a call to action in my meta description increase click-through rate (CTR)? Does having my site or brand in my Title really make a difference?

As search marketers we know the value of copy testing. And Google should want this as well. Wouldn’t a higher CTR (without an increase in pogosticking) be an indication of a better user experience? Over time wouldn’t iterative copy testing result in higher quality SERPs.

Google could even ride shotgun and learn more about user behavior. If you need a new buzz word to get it off the ground, try crowd sourced bucket testing on for size.

This new testing tool can live within Google Webmaster Central Tools and Google should be able to limit the number of outside variables by ensuring the test is only served on one data cluster. For extra credit Google could even calculate the statistical relevance of the results. Maybe you partner with (or purchase) someone like Optimizely to make it happen.

If this tool is on your Christmas list, please Tweet this post.

SEO Metrics Dashboard

December 20 2010 // Analytics + SEO // 6 Comments

There are plenty of SEO metrics staring you right in your face as the folks at SEOmoz recently pointed out.

SEO Metrics Dashboard

I’ll quickly review the SEO metrics I’ve tracked and used for years. Combined they make a decent SEO metrics dashboard.

SEO Visits

Okay, turn in your contractor SEO credentials if you’re not tracking this. Google Analytics makes it easy with their built in Non-paid Search Traffic default advanced segment.

Non-paid Search Traffic Segment

However, be careful to measure by the week when using this advanced segment. A longer time frame can often lead to sampling. You do not want to see this. It’s the Google Analytics version of the Whammy.

Sampled Data Whammy

Alternatively, you can avoid the default advanced segment and instead navigate to All Traffic -> Search Engines (Non-Paid) or drill down under All Traffic Sources to Medium -> Organic. Beware, you still might run into the sampling whammy if you’re looking at longer time frames.

SEO Landing Pages

Using Google Analytics, use the drop down menu to determine how many landing pages drove SEO traffic by week.

SEO Metrics

I’m less concerned with the actual pages then simply knowing the raw number of pages that brought SEO traffic to the site in a given week.

SEO Keywords

Similarly, using the Google Analytics drop down menu, you can determine how many keywords drove SEO traffic by week.

SEO Metrics

Again, the actual keywords are less important to me (at this point) than the weekly volume.

Indexed Pages

Each week I also capture the number of indexed pages. I used to do this using the site: operator but have been using Google Webmaster Tools for quite a while since it seems more accurate and stable.

If you go the Webmaster Tools route, make certain that you have your sitemap(s) submitted correctly since duplicate sitemaps can often lead to inflated indexation numbers.

Calculated Fields

With those four pieces of data I create five calculated metrics.

  • Visits/Keywords
  • Visits/Landing Pages
  • Keywords/Landing Pages
  • Visits/Indexed Pages
  • Landing Pages/Indexed Pages

These calculated metrics are where I find the most benefit. While I do track them separately, analysis can only be performed by looking at how these metrics interact with each other. Let me say it again, do not look at these metrics in isolation.
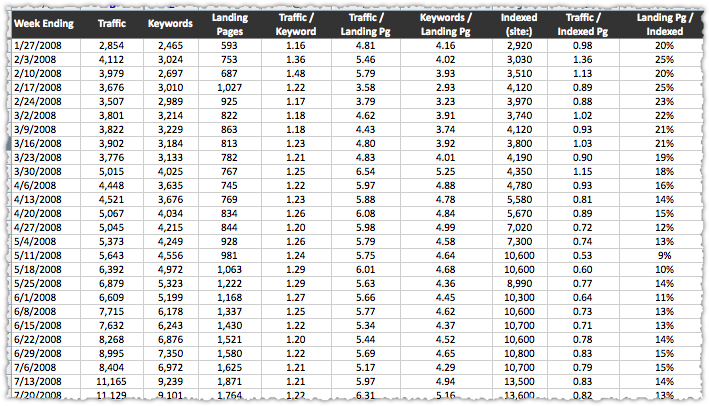
SEO Metrics

Inevitably I get asked, is such-and-such a number a good Visits/Landing Pages number? The thing is there are no good or bad numbers (within reason). The idea is to measure (and improve) the performance of these metrics over time and to use them to diagnose changes in SEO traffic.

Visits/Keywords

This metric can often provide insight into how well you’re ranking. When it goes up, your overall rank may be rising. However, it could also be influenced by seasonal search volume. For example, if you were analyzing a site that provided tax advice, I’d guess that the Visits/Keywords metric would go up during April due to the increased volume for tax terms.

Remember, these metrics are high level indicators. They’re a warning system. When one of the indicators changes, you investigate to determine the reason the metric changed. Did you get more visits or did you receive the same traffic from fewer keywords? Find out and then act accordingly.

Visits/Landing Pages

The Visits/Landing Pages metric usually tells me how effective an average page is at attracting SEO traffic. Again, look under the covers before you make any hasty decisions. An increase in this metric could be the product of fewer landing pages. That could be a bad sign, not a good one.

In particular, look at how Visits/Keywords and Visits/Landing Pages interact.

Keywords/Landing Pages

I use this metric to track keyword clustering. This is particularly nice if you’re launching a new set of content. Once published and indexed you often see the Keywords/Landing Pages metric go down. New pages may not attract a lot of traffic immediately and the ones that do often only bring in traffic from a select keyword.

However, as these pages mature they begin to bring in more traffic; first from just a select group of keywords and then (if things are going well) you’ll find they begin to bring in traffic from a larger group of keywords. That is keyword clustering and it’s one of the ways I forecast SEO traffic.

Visits/Indexed Pages

I like to track this metric as a general SEO health metric. It tells me about SEO efficiency. Again, there is no real right or wrong number here. A site with fewer pages, but ranking well for a high volume term may have a very high Visits/Indexed Pages metric. A site with a lot of pages (which is where I do most of my work) may be working the long-tail and will have a lower Visits/Indexed Pages number.

The idea is to track and monitor the metric over time. If you’re launching a whole new category for an eCommerce site, those pages may get indexed quickly but not generate the requisite visits right off the bat. Whether the Visits/Indexed Pages metric bounces back as those new pages mature is what I focus on.

Landing Pages/Indexed Pages

This metric gives you an idea of what percentage of your indexed pages are driving traffic each week. This is another efficiency metric. Sometimes this leads me to investigate which pages are working and which aren’t. Is there a crawl issue? Is there an architecture issue?  It can often lead to larger discussions about what a site is focused on where it should dedicate resources.

Measure Percentage Change

Once you plug in all of these numbers and generate the calculated metrics you might look at the numbers and think they’re not moving much. Indeed, from a raw number perspective they sometimes don’t move that much. That’s why you must look at it by percentage change.
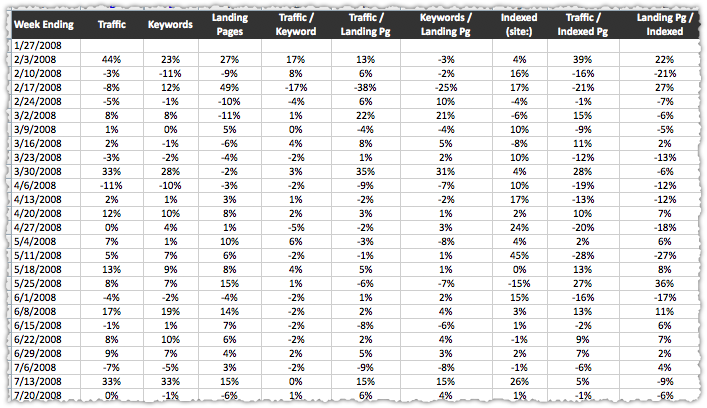
SEO Metrics by Percentage Change

For instance, for a large site moving the Visits/Keyword metric from 3.2 to 3.9 may not look like a lot. But it’s actually a 22% increase! And when your SEO traffic changes you can immediately look at the percentage change numbers to see what metric moved the most.

To easily measure the percentage change I recommend creating another tab in your spreadsheet and making that your percentage change view. So you wind up having a raw number tab and a percentage change tab.

SEO Metrics Analysis

I’m going to do a quick analysis looking back at some of this historical data. In particular I’m going to look at the SEO traffic increase between 3/23/08 and 3/30/08.

SEO Metric Analysis

That’s a healthy jump in SEO traffic. Let there be much rejoicing! To quickly find out what exactly drove that increase I’ll switch to the percentage change view of these metrics.

SEO Metrics Analysis

In this view you quickly see that the 33% increase in SEO traffic was driven almost exclusively by a 28% increase in Keywords. This was an instance where keyword clustering took effect and pages began receiving traffic for more (related) query terms. Look closely and you’ll notice that this increase occurred despite a decrease of 2% in number of Landing Pages.

Of course the next step would be to determine if certain pages or keyword modifiers were most responsible for this increase. Find the pattern and you have a shot at repeating it.

Graph Your SEO Metrics

If you’re more visual in nature create a third tab and generate a graph for each metric. Put them all on the same page so you can see them together. This comprehensive trend view can often bring issues to the surface quickly. Plus … it just looks cool.

Add a Filter

If you’re feeling up to it you can create the same dashboard based on a filter. The most common filter would be conversion. To do so you build an Advanced Segment in Google Analytics that looks for any SEO traffic with a conversion. Apply that segment, repeat the Visits, Landing Pages and Keywords numbers and then generate new calculated metrics.

At that point you’re looking at these metrics through a performance filter.

The End is the Beginning

Circular Google Logo

This SEO metrics dashboard is just the tip of the iceberg. Creating detailed crawl and traffic reports will be necessary. But if you start with the metrics outlined above, they should lead you to the right reports. Because the questions they’ll raise can only be answered by doing more due diligence.

Kill Infographic Spam

December 11 2010 // Rant + SEO // 3 Comments

Infographics can be a great way to generate backlinks. But the prevalence of infographic spam threatens this link building technique.

Infographic Spam

You’ve undoubtedly seen infographic spam. The hallmarks of infographic spam are a mediocre graphic from multiple data sources with a link back to a tenuously related website.
Infographic Spam

This TSA infographic is linked to a criminal justice degree site. Related? Barely. Of note, nice going keeping the utm parameters in your source link.

Infographic Spam

Here’s one about the sexual revolution that’s linked by to a site offering online counseling degrees. Related? No.

Pay per Infographic

Oh, did I mention that they pay sites to post infographics? Earlier this year Aaron Wall wrote about link buyers outing themselves. Well here’s a similar example.

Infographic Spam

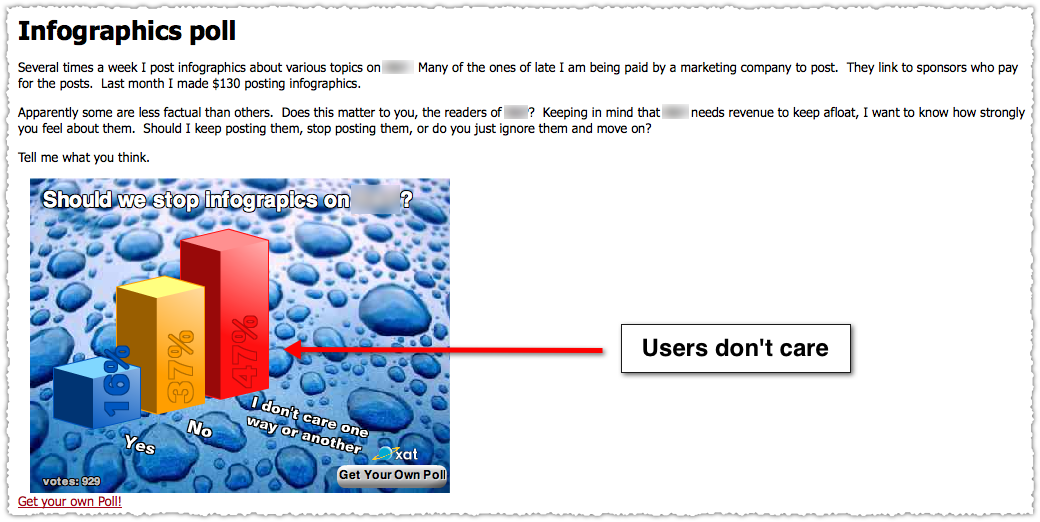
This is an actual post where the site owner admits to posting infographics for money and asking if readers mind. The verdict? Readers are fine with it. But I’m not, and neither should you.

The sites that generate this garbage are usually making a lot of money – most often coming from the lucrative education vertical. But what about this guy? What about the individual site owner? He’s making just $130. I don’t blame the guy really. He’s just trying to break even on this site and maybe make a little bit in the bargain.

Paid Links vs Paid Infographics

In my mind, there is a big difference between paid links and paid infographics. Paid links are essentially static. You’re renting the trust and authority of that site and probably getting a bit of traffic as well. There’s no expectation of amplification. Said another way, paid links aren’t viral.

Paid infographics are problematic because they are engineered to create additional installations through social distribution and embeds.

Viral Infographic Spam

The sole purpose of infographic spam is to drive keyword specific anchor text from multiple domains. Domain diversity anyone?

In addition, when buying links you’re usually looking for links from sites that are similar in topic. You’re seeking to build your profile in a certain neighborhood.

As an aside, this is exactly what you’re doing if you buy a directory listing. You’re buying the trust and authority from a relevant section of that directory. I’m still not sure why one is verboten and the other is okay, but that’s a topic for another post. While I don’t actually recommend buying links, I don’t find the transaction to be that disturbing.

Nevertheless, there’s no such targeting involved in paid infographics. It’s the Sherman’s March of link building.

Algorithm Blues

Google Blues

It doesn’t seem like the algorithm is currently capable of finding infographic spam. I can completely understand why it might be difficult.

The link graph may not be that different for paid and non-paid infographics. Because once an infographic gets out in the wild, the viral component takes over. Users don’t care about the little bit of HTML at the bottom of the infographic, they just think it’s interesting. As the poll above showed, even when told, users aren’t running to Google to file a spam report.

You can’t use anchor text bombing as a signal since any good SEO is going to use proper anchor text in an infographic.

Now, perhaps you could work to determine whether the source sites (where it first appeared) between infographics differed. Yet, the example I provided mentions that ‘many’ of the infographics posted of late were paid. So, he might be mixing in ones found and enjoyed with ones where he’s getting paid. So is his site a poison source site or not?

In the end, maybe we need a little human intervention and outreach. A couple of emails, a bit of sleuthing and some Law & Order type of immunity deals and I think you’d locate the sites and intermediaries who were polluting the infographic space. I’m not advocating going after the posting sites or contract designers but instead the sponsors of this content.

Am I entirely comfortable with Google using their nuclear option (the dreaded penalty) in this type of subjective manner? No. But lately I’m seeing way too much getting through the algorithm (both infographic and otherwise) and relying on users to report spam doesn’t seem like enough.

Do you care about infographic spam? If so, what would you do to stop it?

My Name is Miami Attorneys (and now SEO must die)

December 03 2010 // Humor + Rant + SEO // 5 Comments

The other day I followed a ping back to Elsewhere. There I found a fantastic blog commenting policy.

I’ve turned “nofollow” back on for links in comments.I can find a good WordPress plugin from Collectiveray.com that allows me to disable this on a per-comment basis, I will manually remove that on comments I think deserve it.

Use your name, nickname, pseudonym, handle, or other personally-relevant identifier in the “Name” field. Your name is not “Miami Attorneys” or “Solar Panels” or “Bingo Games”. If you use a product or site name as your own name and it makes it through the spam filters, I will manually delete it. This applies to obvious keyword linking, too. The keyword you’re trying to boost is not your name. If you use it as your name, I will remove your comment. Use your own name, or something reasonably name-like.

Linking to the site you’re promoting is fine, as long as it’s relevant to the post or other comments in the thread. If I feel it is spammy, I may delete the link or the whole comment, depending on my mood. Your link will have rel=”nofollow” applied, unless I think it deserves otherwise.

If you are not a spammer or SEO practitioner, you probably don’t know what any of that meant. Don’t worry about it; it doesn’t apply to you.

This is why so many people hate SEO and you really can’t blame them either. The sad truth is that most people lump SEO in with this obnoxious form of blog commenting spam. This is what they see, despite the reality. Which got me thinking.

Dread Pirate SEO

Most people probably think of SEO as the Dread Pirate Roberts.

Dread Pirate SEO

If you’re familiar with The Princess Bride (and you should!) then you know that the Dread Pirate Roberts was thought to be an incredible villain. What they didn’t know (among other things) was that the Dread Pirate Roberts wasn’t just one person.

So you can think of the Dread Pirate SEO declaring that his name is Miami Attorneys on blog after blog, taking no prisoners in his quest for keyword anchor text.

SEO Must Die

Of course this provokes a rather normal reaction.

SEO Must Die

Yes, a phalanx of Inigo Montoyas rise up to call for the head of the Dread Pirate SEO. They seek to battle him at every turn, not knowing the truth behind the mask.

Inconceivable!

The problem is what most people see looks like (and often is) trickery. Yes, many in our profession are true Dread Pirate SEO. Compounding this is the fact that every good SEO does know some tricks. Not only that, but many like to poke and prod the algorithm in an effort to understand what will really work.

SEO Trickery

SEOs enjoy this battle of wits. And we like to win. However, it may give many the wrong impression of our true purpose.

We’re Westley

Dread Pirate SEO is actually … a good guy!

SEO Good Guy

Good SEO is simply ensuring that your content finds the right audience. It would be nice if a good site or great content would immediately rank for the right queries. But that’s not what happens, despite the Google dogma. Instead, SEO is there to storm the castle and ensure that your time and effort is rewarded with the right traffic. That your site and content are seen by the right people.

Will most people ever think of SEO as their ally? Probably not. That just happens in the movies.

Bounce Rate vs Exit Rate

November 15 2010 // Analytics + SEO // 23 Comments

One of the most common Google Analytics questions I get is to explain the difference between bounce rate and exit rate. Here’s what I hope is a simple explanation.

Bounce Rate

Bounce Rate

Bounce rate is the percentage of people who landed on a page and immediately left. Bounces are always one page sessions.

High bounce rates are often bad, but it’s really a matter of context. Some queries may inherently generate high bounce rates. Specific informational queries (e.g. – What are the flavors of Otter Pops?) might yield high bounce rates. If the page fulfills the query intent, there may be no further reason for the user to engage. It doesn’t mean it was a bad experience, it just means they got exactly what they wanted and nothing more. (I was always partial to Louie-Bloo Raspberry or Alexander the Grape.)

A high bounce rate on a home page is usually a sign that something is wrong. But again, make sure you take a close look at the sources and keywords that are driving traffic. You might have a very low bounce rate for some keywords and very high for others. Maybe you’re getting a lot of StumbleUpon traffic which, by its very nature, has a high bounce rate.

Bounce rate is important but always make sure you look beyond the actual number.

Exit Rate

Exit Rate

Exit rate is the percentage of people who left your site from that page. Exits may have viewed more than one page in a session. That means they may not have landed on that page, but simply found their way to it through site navigation.

Like bounce rates, high exit rates can often reveal problem areas on your site. But the same type of caution needs to be applied. If you have a paginated article – say four pages – and the exit rate on the last page is high, is that really a bad thing? They’ve reached the end of the article. It may be natural for them to leave at that point.

Of course, you’ll want to try different UX treatments for surfacing related articles or encourage social interactions to reduce the exit rate, but that it was high to begin with shouldn’t create panic.

Exit rate should be looked at within a relative navigation context. Pages that should naturally create further clicks, but don’t, are ripe for optimization.

(Extra points if you get my visual ‘bounce’ reference.)

But There’s More! I’ve developed the Ultimate Guide to Bounce Rate to answer all of your bounce rate questions. This straight-forward guide features Ron Paul, The Rolling Stones and Nyan Cat. You’re sure to learn something and be entertained at the same time.

Google Indent Massacre

November 11 2010 // Humor + SEO // 2 Comments

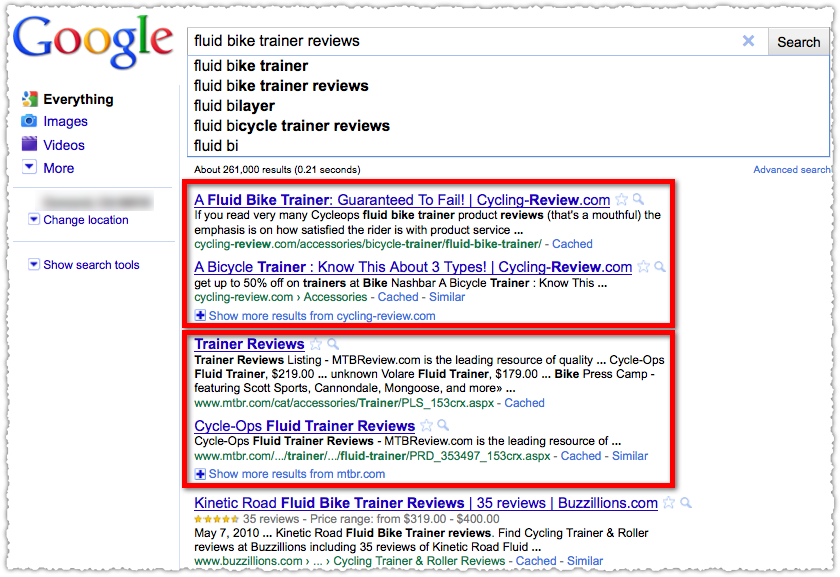
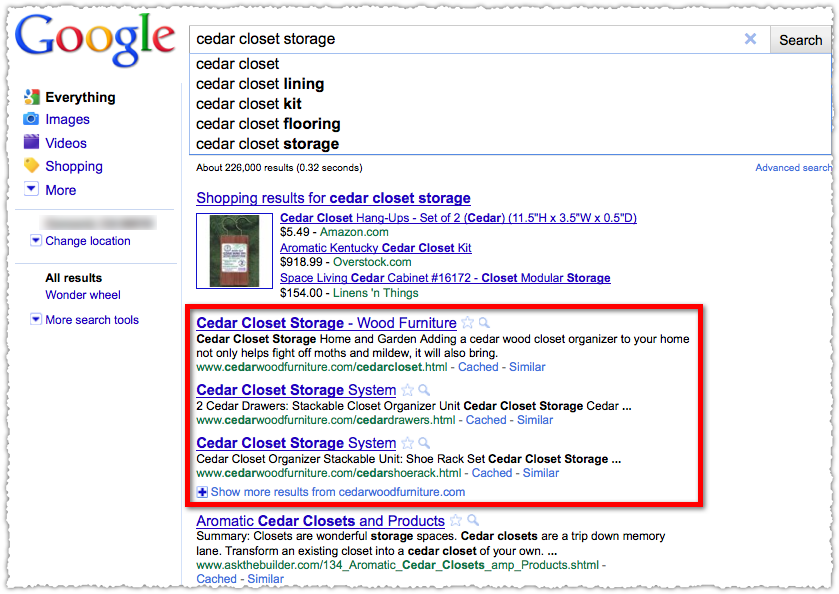
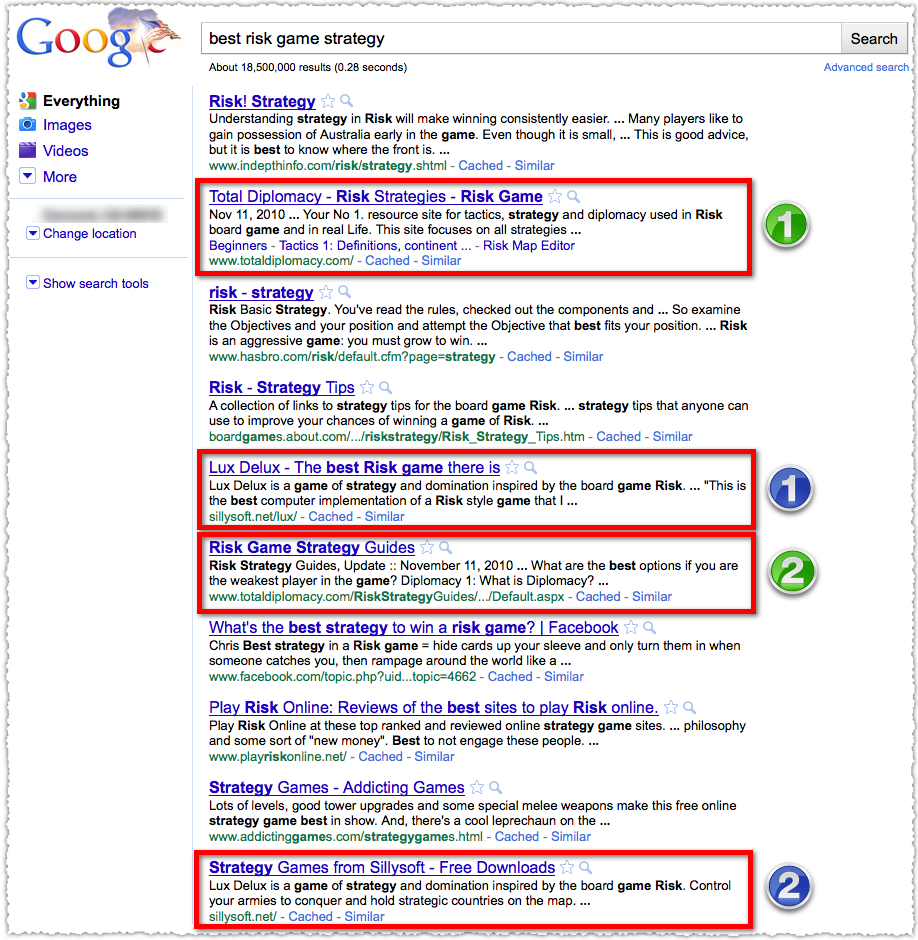
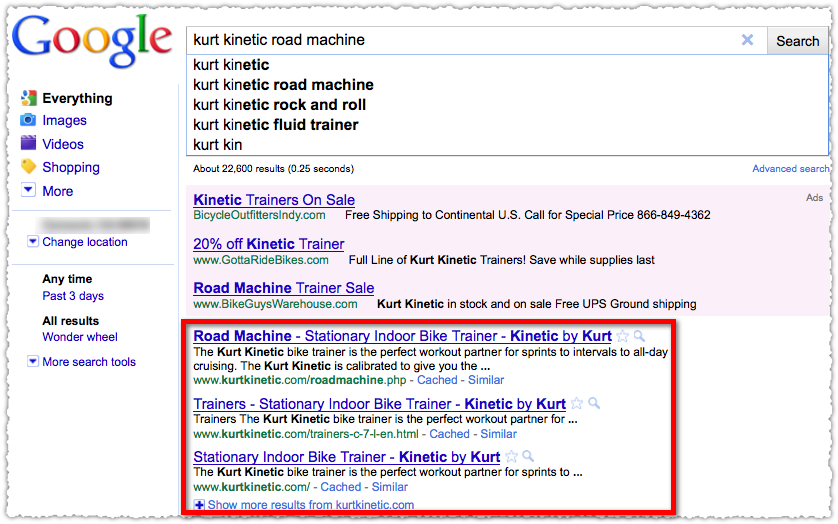
Reports are coming in from queries around the Internet about the unprovoked attack by Google on indents. Please be aware that the following screencaps may not be suitable for younger viewers.

Google Indent Massacre

Google Indents Gone

Google Indents Gone

Google Indents Gone

Google Indent Hostilities

Hostilities against indents boiled over at 2010 SMX Advanced.

Danny goes on a rant about indented listings — can’t they go away? Danny yells “death to the indents” and half the audience boos!

While Matt Cutts declined to take a position during this flare up, the cozy relationship between Danny Sullivan and Google’s Matt Cutts is well documented.

Google Indent Appeasement

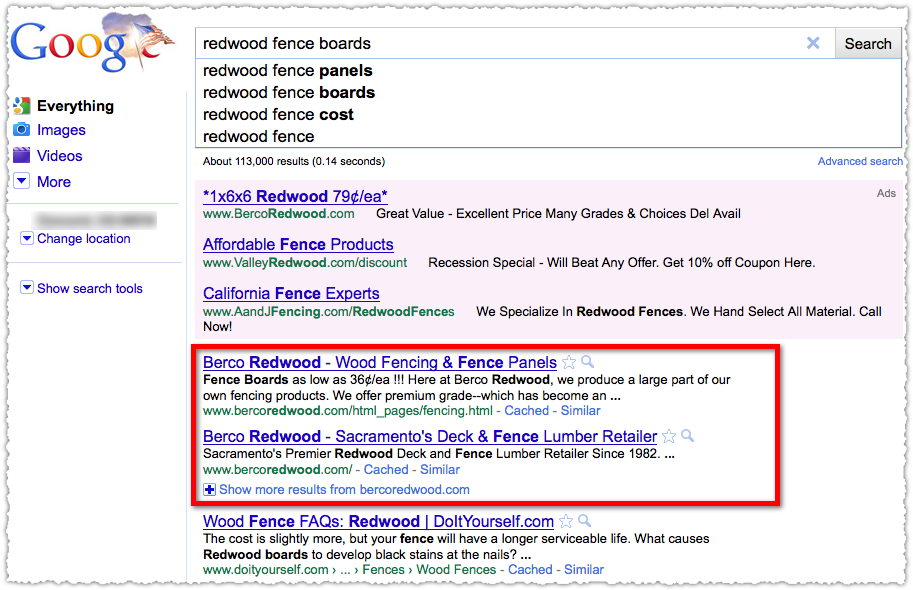
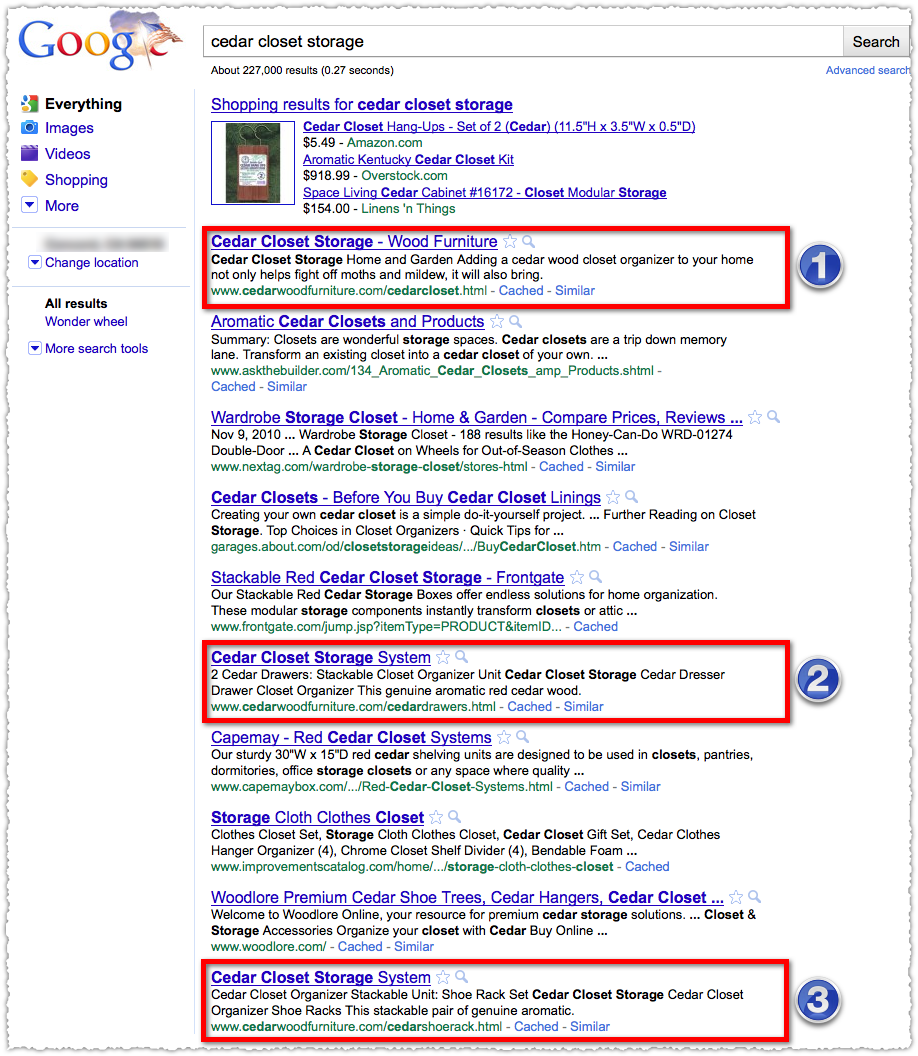
Searches on the ground report that Google is now presenting three consecutive listings in some cases.

Google Indents Gone

Google Indents Gone

Google Indents Gone

Will these efforts at appeasement mollify pro-indent supporters? To date, Google and anti-indent activist Sullivan remain silent on these activities.

We’ll monitor the situation and provide updates as they become available.

November 12th Update

Embedded reporters are now telling us that Google is no longer providing domain grouping on search results.

Google Domain Grouping Gone

Google Domain Grouping Gone

The fragile relationship indents had with Google seems fractured with what pro-indent supporters call ‘a step backward’. Google will only say that they conduct many bucket tests to determine the best search results for users. Such tests are cold comfort for the millions of indents that have been suddenly removed from SERPs.

November 18th Update

The demise of indents seems all but sealed. Yesterday, Google unilaterally released a statement confirming that they’re “expanding the feature so that, when appropriate, more queries show additional results from a domain.”

The statement also tells us that while up to four results from a domain may be presented, additional results will have single-line compact snippets.

Google Indents Gone

As you can see, this two result domain listing uses a single-line compact snippet instead of an indented full-snippet result.

No matter the clever wording used in Google’s statement to ingratiate themselves to the world audience, indents have been marginalized and are approaching extinction. Indent preservation campaigns in Skitch, TinyGrab, SnagIt and others are working to capture indent images so that they can always be remembered.

xxx-bondage.com